
How Leaders Use Deep Opportunity Insight & Strategic Data Management to Outperform Markets
A) Executive Strategic Snapshot (15-Second Read)

The Core Truth 2026+:
Markets are no longer won by better execution, but by earlier, calmer, structurally advantaged decisions.
Most organizations:
- Optimize inside visible markets
- React to signals after they are priced in
- Use AI to analyze, not to capture
Winners use:
- Deep Opportunity Insight (DOI)
- Strategic Data Management (SDM)
- Prompt-driven value capture systems
B) Why Traditional Strategy Fails After 2025
1️⃣ The Strategy Timing Collapse
- Annual strategy cycles are obsolete
- Quarterly steering is already late
- Decisions now decay in value within weeks
Insight: Strategy is no longer what you decide — but when you decide.
2️⃣ The Data Illusion
Organizations drown in:
- Dashboards without decisions
- KPIs without consequence
- Reports without authority
Strategic Data ≠ Big Data
Strategic data must:
- Change a decision
- Shift a priority
- Reallocate cash-flow
If it doesn’t → delete it.
C) The RapidKnowHow Deep Opportunity Insight (DOI) System
The DOI Operating Loop

DOI Loop:
- Detect underpriced change
- Translate into decision advantage
- Rank by value capture potential
- Act before consensus forms
- Lock in structural advantage
This is pre-market strategy.
D) Strategic Data Management (SDM): The Filter That Matters
Only data answering one of these four questions is allowed:
| Strategic Question | Value Impact |
|---|---|
| What is accelerating unnoticed? | Timing advantage |
| Where is friction becoming leverage? | Margin capture |
| Which delay destroys cash-flow? | Speed arbitrage |
| Who controls the bottleneck? | Power position |
Everything else is operational noise.
E) The ROICE-X Opportunity Ranking Model
Board-Grade Formula
ROICE-X = (Δ Cash-Flow × Speed Advantage × Control Factor) ÷ Complexity
Interpretation:
- Δ Cash-Flow → measurable impact within 12–24 months
- Speed Advantage → weeks/months gained vs competitors
- Control Factor → ownership of constraint, not volume
- Complexity → execution drag (kills value fast)
If Complexity > Control, reject.
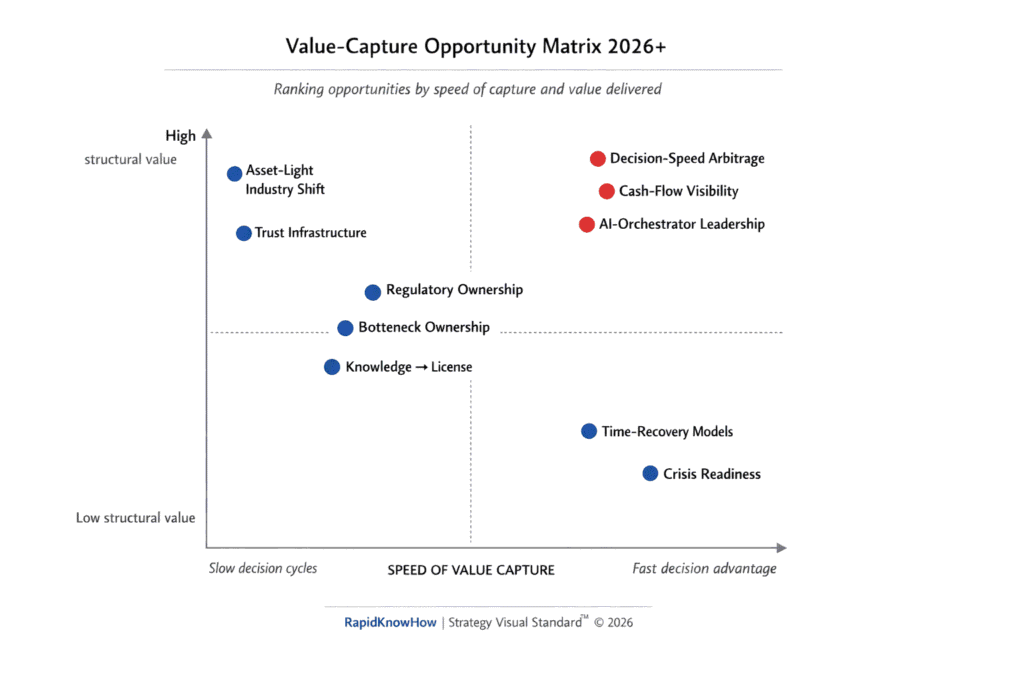
F) The Top 10 Asymmetric Value Opportunities (2026+)


🥇 1. Decision-Speed Arbitrage
Capture: Faster strategic calls under uncertainty
Why it wins: Delay is now the biggest cost
Models: Board games, simulations, decision retainer
🥈 2. Cash-Flow Visibility Before Commitment
Capture: Seeing cash impact before action
Why: Accounting is backward-looking
Models: CFO dashboards, scenario alerts
🥉 3. AI-Orchestrator Leadership Systems
Capture: Leaders who direct AI, not delegate to it
Why: Tools are commoditized, orchestration is scarce
Models: Licensing, certification, ecosystems
4️⃣ Regulation as Competitive Moat
Capture: Turning compliance into growth leverage
Why: Fear freezes competitors
Models: Compliance-as-Strategy platforms
5️⃣ Asset-Light Industry Rewrites
Capture: Removing CapEx drag from legacy sectors
Why: Balance sheets suffocate agility
Models: BaaS, long-term service contracts
6️⃣ Bottleneck Ownership
Capture: Control of the slowest, most painful step
Why: Power always sits at constraints
Models: Platform control, toll gates
7️⃣ Crisis Readiness Monetization
Capture: Selling preparedness, not firefighting
Why: Crises are permanent
Models: Retainers, readiness audits
8️⃣ Knowledge → License → Ecosystem
Capture: Turning expertise into systems
Why: Consulting doesn’t compound
Models: Royalties, partner markets
9️⃣ Trust Infrastructure
Capture: Decision-grade truth in noisy environments
Why: Misinformation destroys confidence
Models: Premium intelligence subscriptions
🔟 Time-Recovery Models
Capture: Selling time saved, not features
Why: Time is the scarcest resource
Models: Outcome-based pricing
G) The One Question Every Board Must Answer
“Which decision, if made 30 days earlier than competitors, would permanently improve our cash-flow trajectory — and why haven’t we made it yet?”
If the answer is unclear:
- Strategy is missing
- Leadership is reactive
- Value will leak
H) How This Becomes a Competitive Weapon
Organizations that win in 2026+:
- Rank opportunities monthly, not annually
- Use prompts as strategic instruments
- Treat insight as a monetizable asset
- Lock in advantage before markets agree
Those who don’t:
- Optimize declining models
- Argue with lagging indicators
- Discover too late that value moved elsewhere
How to measure how quickly new market opportunities are identified
this goes straight to decision advantage, not vanity KPIs.
Here’s a clean, board-usable way to measure how quickly new market opportunities are identified — not “analyzed”, identified early enough to matter.
A) The Core Principle
Opportunity speed is not time-to-report — it is time-to-decision-readiness.
An opportunity is identified only when:
- It is decision-relevant
- It is ranked
- It can trigger action or rejection
Anything earlier is just signal noise.
B) The 4 Metrics That Actually Measure Opportunity-Speed

4
1️⃣ Signal-to-Insight Time (SIT)
What it measures:
How long it takes to turn a weak signal into a strategic insight
Formula:
SIT = Date of decision-grade insight – Date of first detectable signal
Benchmark:
- ❌ > 90 days → reactive organization
- ⚠️ 30–90 days → average
- ✅ < 30 days → early mover
- 🟢 < 14 days → asymmetric advantage
Board question:
“When did we first see this — and when did we understand it?”
2️⃣ Insight-to-Ranking Time (IRT)
What it measures:
Speed from insight to formal prioritization
Formula:
IRT = Date ranked in Top-X portfolio – Date insight was formulated
Why it matters:
Most organizations see opportunities but never rank them → value dies in ambiguity.
Benchmark:
- ❌ > 45 days → strategy paralysis
- ✅ < 14 days → decision discipline
- 🟢 < 7 days → decision culture
3️⃣ Opportunity Half-Life (OHL)
What it measures:
How fast an opportunity loses value if not acted upon
Definition:
Time until 50% of potential value is gone due to:
- Competitor moves
- Regulation
- Cost inflation
- Narrative lock-in
Key insight:
If OHL < your decision cycle, you structurally lose.
Board rule:
“If the half-life is shorter than our governance cycle — we don’t have a strategy.”
4️⃣ Decision Latency Index (DLI)
What it measures:
Organizational delay after opportunity is already clear
Formula:
DLI = Decision date – Date opportunity was decision-ready
Interpretation:
- DLI caused by analysis → acceptable
- DLI caused by politics, fear, unclear authority → value destruction
Healthy organizations:
DLI < OHL
C) The Opportunity-Speed Score (OSS) — One Number for the Board
You can combine all four into a single board KPI:
OSS = (OHL – (SIT + IRT + DLI)) ÷ OHL
Meaning:
- 🟢 OSS > 0.4 → opportunity captured early
- 🟡 OSS 0–0.4 → marginal advantage
- 🔴 OSS < 0 → opportunity identified too late
This turns speed into a measurable strategic asset.
D) What High-Performing Organizations Do Differently

4
They:
- Track first signal dates explicitly
- Force ranking within days, not weeks
- Assign decision owners, not committees
- Kill 70–80% of opportunities fast (this increases speed)
They do not:
- Wait for certainty
- Confuse dashboards with decisions
- Treat speed as an operational issue
E) The One Diagnostic Question to Use Immediately
Ask this in your next leadership meeting:
“Which opportunity did we see early but act on late — and what exactly slowed us down?”
If the answer is unclear:
- Opportunity speed is low
- Value leakage is structural
- AI won’t fix it — governance will