A) THE ROCE MECHANIC (COMMON GROUND FOR THE BOARD)
ROCE Formula (no debate)
ROCE = EBIT / Capital Employed
So there are only two real levers:
- Increase EBIT (numerator)
- Reduce or accelerate Capital Employed (denominator)
Everything else is noise.
B) THE 7 CRITICAL DIFFERENTIAL DRIVERS (TRADITIONAL vs AI-DRIVEN)
Driver 1: Asset Intensity
| Traditional | AI-Driven |
|---|---|
| Plants, cylinders, trucks dominate | Platforms, software, contracts dominate |
ROCE Impact
- Capital Employed ↓ 10–30%
- Same EBIT → ROCE jumps mechanically
📌 This is the single biggest structural lever.
Driver 2: Capacity Utilisation
| Traditional | AI-Driven |
|---|---|
| Static planning, buffers | AI forecasting, dynamic optimisation |
ROCE Impact
- EBIT ↑ 5–10%
- Same capital, more output
📌 Idle assets are silent ROCE killers.
Driver 3: Pricing Power
| Traditional | AI-Driven |
|---|---|
| Cost-plus, contracts, discounts | Value-based, usage-based, dynamic pricing |
ROCE Impact
- EBIT ↑ 3–8%
- Zero capital increase
📌 Pricing is EBIT without CAPEX.
Driver 4: Working Capital Velocity
| Traditional | AI-Driven |
|---|---|
| Inventory buffers, slow billing | Predictive supply, automated billing |
ROCE Impact
- Capital Employed ↓ 5–15%
- Faster cash conversion cycle
📌 Speed beats scale.
Driver 5: Service & Digital Margin
| Traditional | AI-Driven |
|---|---|
| Gas molecule margins | Service, data, uptime margins |
ROCE Impact
- EBIT ↑ disproportionately
- Minimal incremental capital
📌 This is why Service & Digital explodes ROCE.
Driver 6: Risk Profile (WACC Effect)
| Traditional | AI-Driven |
|---|---|
| Volume & energy risk | Recurring, diversified revenues |
ROCE Impact
- Lower risk → lower capital buffers
- Frees capital indirectly
📌 Stability is a hidden ROCE lever.
Driver 7: Management Attention
| Traditional | AI-Driven |
|---|---|
| Firefighting operations | Orchestration & steering |
ROCE Impact
- Better capital allocation
- Fewer bad investments
📌 Bad decisions destroy ROCE faster than bad markets.
C) ROCE IMPACT SUMMARY (NUMBERS THAT MATTER)
Illustrative Comparison (Industrial Gas Mid-Large Player)
| Metric | Traditional | AI-Driven |
|---|---|---|
| EBIT | €750m | €900m |
| Capital Employed | €5.0bn | €3.8bn |
| ROCE | 15.0% | 23.7% |
Δ ROCE: +8.7 percentage points
Not from heroics — from structure.
D) DRIVER-TO-ROCE IMPACT MAP
| Driver | EBIT Effect | Capital Effect | ROCE Impact |
|---|---|---|---|
| Asset-light shift | — | ↓↓↓ | ★★★ |
| Capacity optimisation | ↑ | — | ★★ |
| Pricing analytics | ↑↑ | — | ★★★ |
| Working capital speed | — | ↓↓ | ★★ |
| Service & Digital | ↑↑↑ | ↓ | ★★★★ |
| Risk reduction | — | ↓ | ★ |
| Better governance | ↑ | ↓ | ★★ |
⭐ Service & Digital + Asset-Light = ROCE engine
E) BOARD-LEVEL TAKEAWAY (NO FLUFF)
ROCE does not improve because people work harder.
It improves because the business needs less capital to earn more EBIT.
AI does not replace assets.
It makes assets obey.
F) DECISION GUIDANCE FOR THE BOARD
If the board wants ROCE >20% sustainably, it must approve:
- Capital reallocation from assets → services & platforms
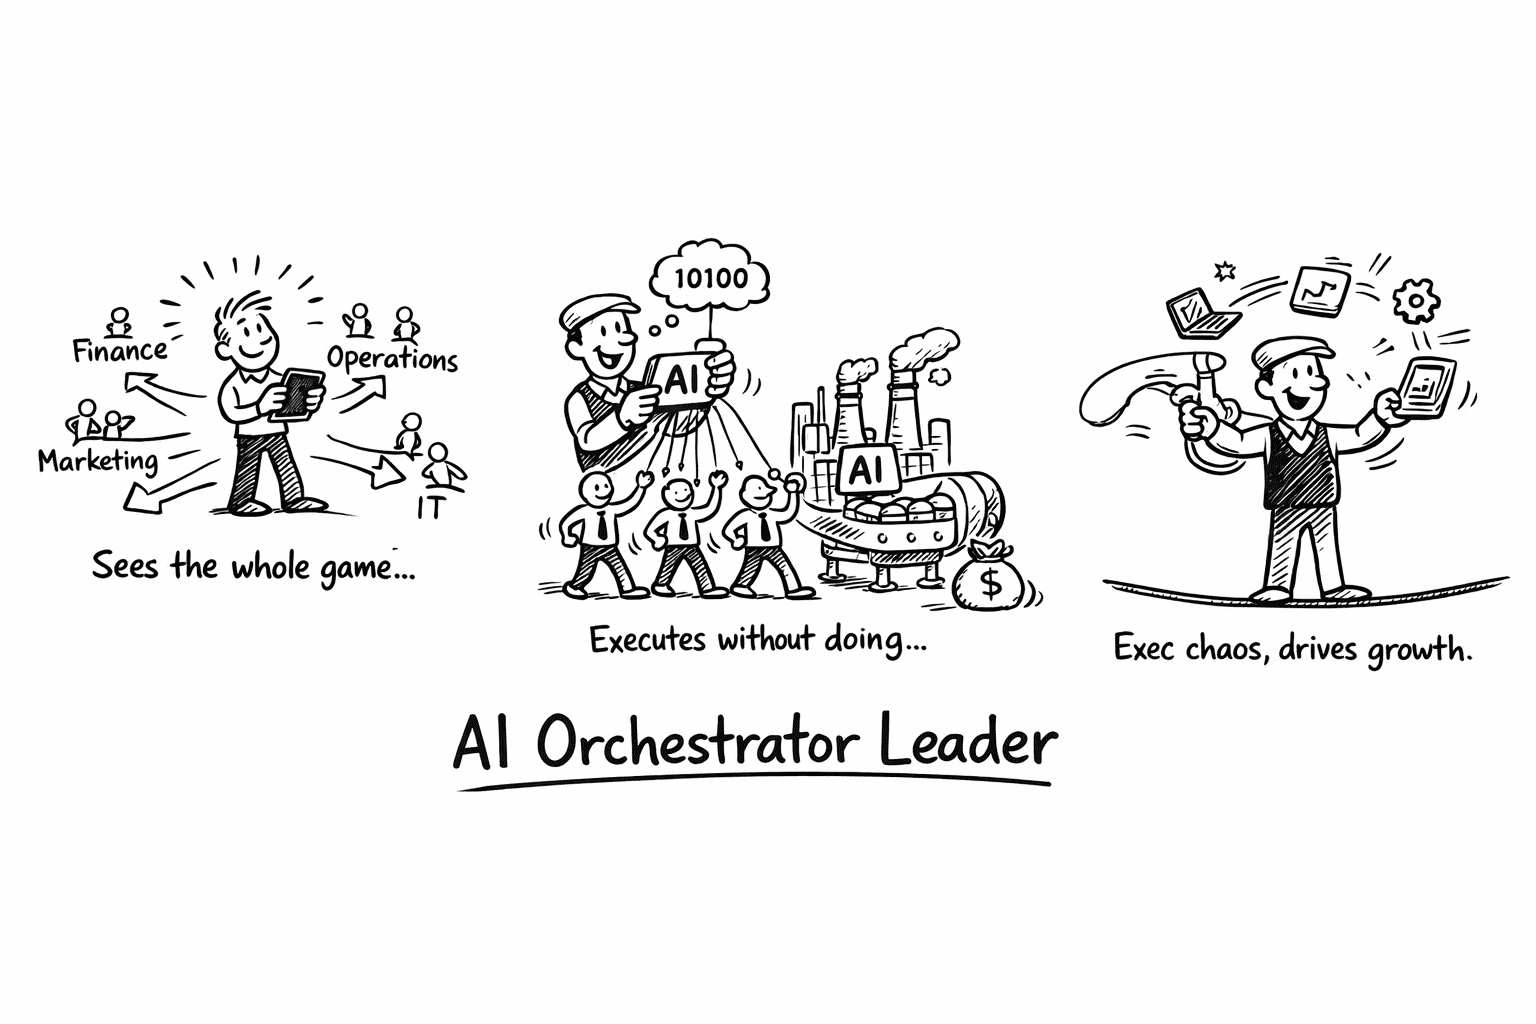
- AI Orchestrator governance (not IT projects)
- ROCE targets by business area, not consolidated averages
- Stop funding anything that cannot be doodled in 15 seconds
G) ONE-SENTENCE POWER STATEMENT (BOARD-READY)
“Traditional ROCE is earned by owning assets; AI-driven ROCE is earned by orchestrating them.”– Josef David