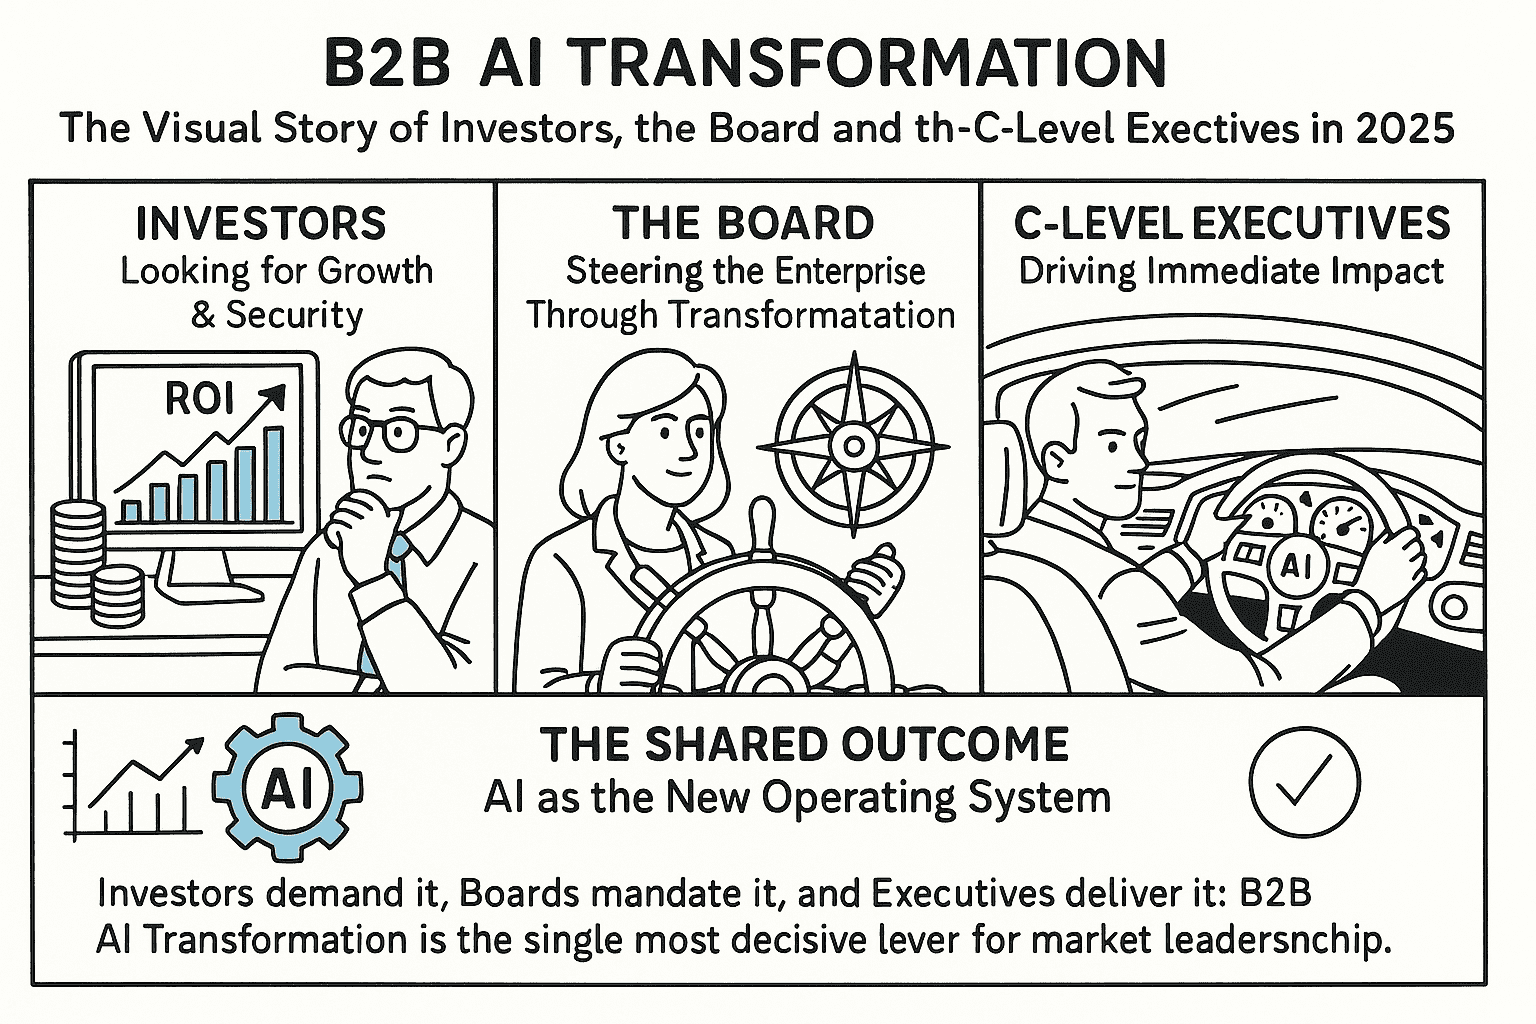
🎥 B2B AI TRANSFORMATION
The Visual Story of Investors, the Board, and the C-Level Executives in 2025
1️⃣ Investors: Looking for Growth & Security
- Expectation: Clear ROI, sustainable cashflows, risk mitigation.
- AI Promise:
- 20–30% revenue growth via new business models.
- 50–70% cost savings through automation.
- Stable recurring income streams (BaaS).
- Visual Metaphor: ROI Dashboard – showing AI as a growth engine.
2️⃣ The Board: Steering the Enterprise Through Transformation
- Expectation: Strategic clarity, risk management, governance.
- AI Promise:
- Data-driven insights for better oversight.
- Faster adaptation to disruption.
- Transparent KPIs to track AI progress.
- Visual Metaphor: Steering Wheel / Compass – AI as navigation system for corporate governance.
3️⃣ C-Level Executives: Driving Immediate Impact
- Expectation: Fast results, operational excellence, customer centricity.
- AI Promise:
- Predictive customer insights for stronger loyalty.
- Automated processes reducing time-to-market.
- Empowered workforce with AI-augmented decisions.
- Visual Metaphor: Race Car Dashboard – executives steering AI to win the market.
4️⃣ The Shared Outcome: AI as the New Operating System
- Investor View: ROI secured.
- Board View: Risk managed, growth governed.
- Executive View: Results delivered, markets won.
- Overall: AI is not a tool – it is the strategic backbone of B2B in 2025–2030.
🧭 Call to Action
👉 In 2025, Investors demand it, Boards mandate it, and Executives deliver it:
B2B AI Transformation is the single most decisive lever for market leadership.– Josef David
B2B AI Leaders vs Laggards (2025 → 2030)
1) Side-by-side comparison (clear, simple)
| Dimension | AI Leaders (Trajectory 2025→2030) | AI Laggards (Trajectory 2025→2030) |
|---|---|---|
| Strategy | AI tied to top-3 P&L goals; portfolio of pilots with scale gates each quarter. | Tool-driven experiments without economic targets; sporadic pilots. |
| Business Model | Shift to BaaS/recurring: 40–70% revenue recurring by 2030. | <15% recurring; product-only pricing. |
| Data & Platforms | Governed data products; shared AI platform; reusable components. | Siloed datasets; bespoke builds per use case. |
| Operations | >60% of priority processes automated; decisions in minutes. | <20% automated; decisions in days/weeks. |
| Customers | Predictive CX; hyper-personalization; churn −20–40%. | Batch marketing; churn flat or rising. |
| People & Skills | >70% knowledge workers AI-augmented; role redesign & incentives. | <25% adoption; training optional, no role redesign. |
| Risk & Governance | Model risk, security, and compliance built-in; audit trails by design. | Ad-hoc approvals; periodic clean-ups after incidents. |
| Capital Allocation | Stage-gated funding; scale after proven ROI in 90 days. | Big-bang programs; sunk-cost bias. |
3) 5-minute self-diagnostic (score 0–2 each; 0=no, 1=partial, 2=yes)
- AI tied to 3 explicit P&L goals
- Recurring/BaaS revenue >20% today or plan to reach 40%+
- Reusable AI platform with governed data products
- ≥3 high-value processes live with measurable ROI
- 70%+ of knowledge workers trained/using AI weekly
- Predictive CX in sales/service; churn trending down
- Model risk & security framework operating
- Stage-gated funding with 90-day proof points
Interpretation: 14–16 = Leader; 10–13 = Transition; ≤9 = Laggard.
4) 12-month catch-up play (for laggards)
- Q4 ’25: Pick one P&L goal; stand up an AI platform pilot; appoint product owners.
- Q1 ’26: Launch 3 pilots (sales, supply chain, service) with weekly ROI tracking.
- Q2 ’26: Scale the 2 best pilots; introduce recurring pricing on one offer.
- Q3 ’26: Formalize model risk & data products; train 50% workforce in AI use.
- By Q3 ’26 outcomes: ≥15% recurring revenue, 30% cycle-time cut in 2 processes, executive dashboard live.


