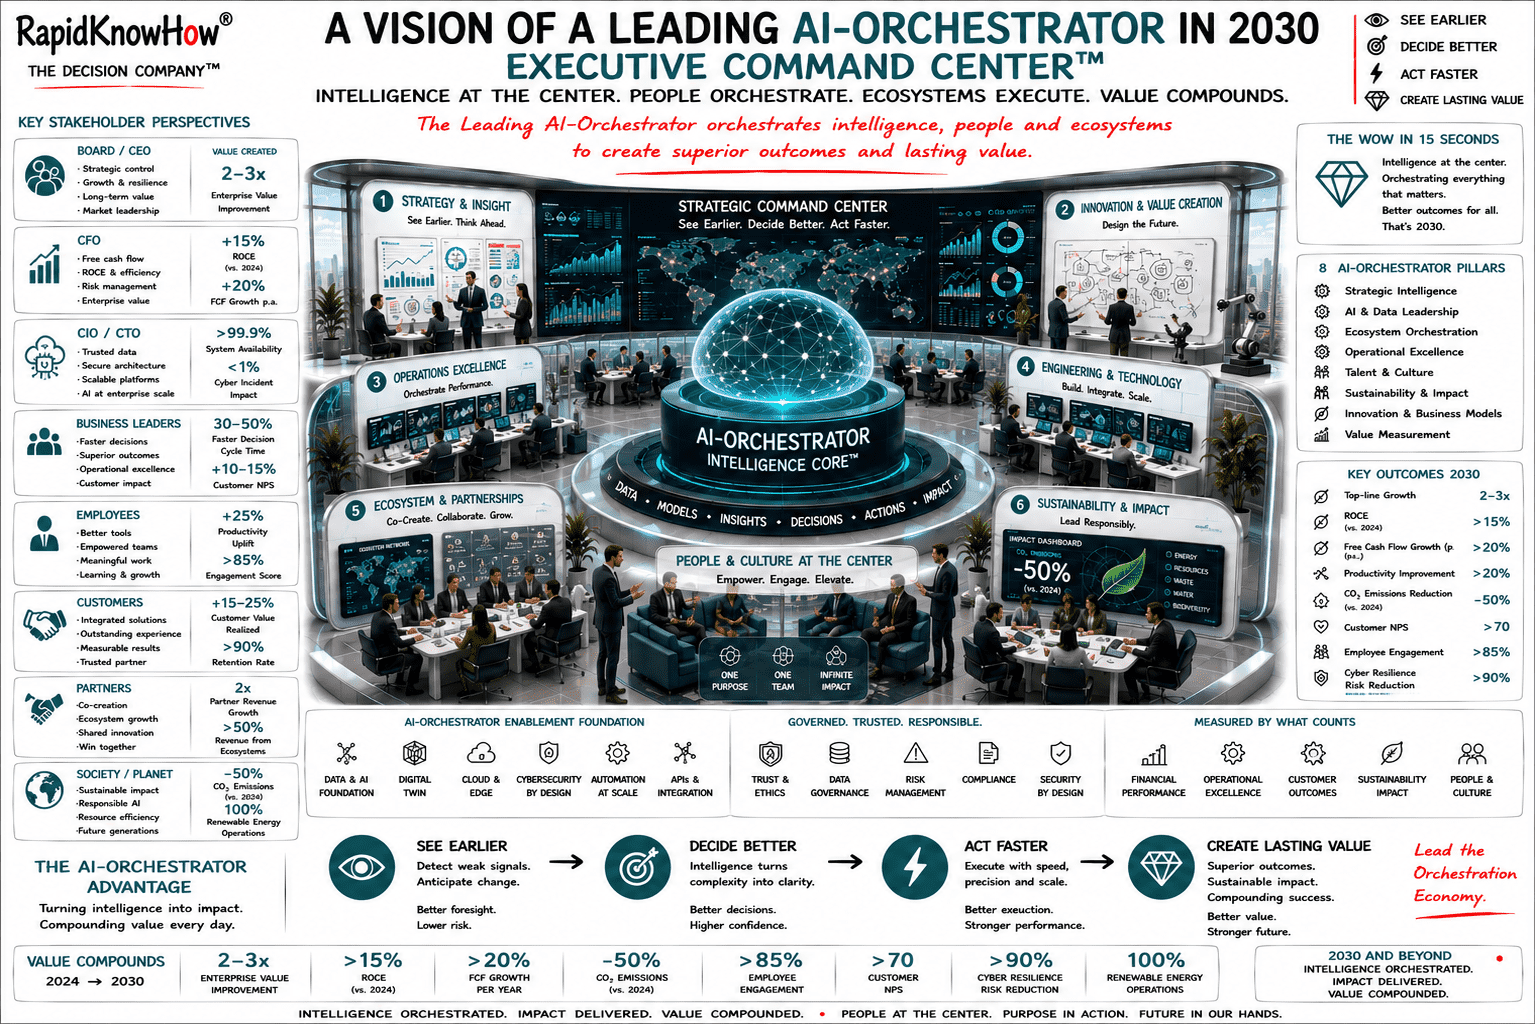
The RapidKnowHow AI-Orchestrator Command Center MASTER turns information overload into board ready decisions and measurable action within one structured leadership session.
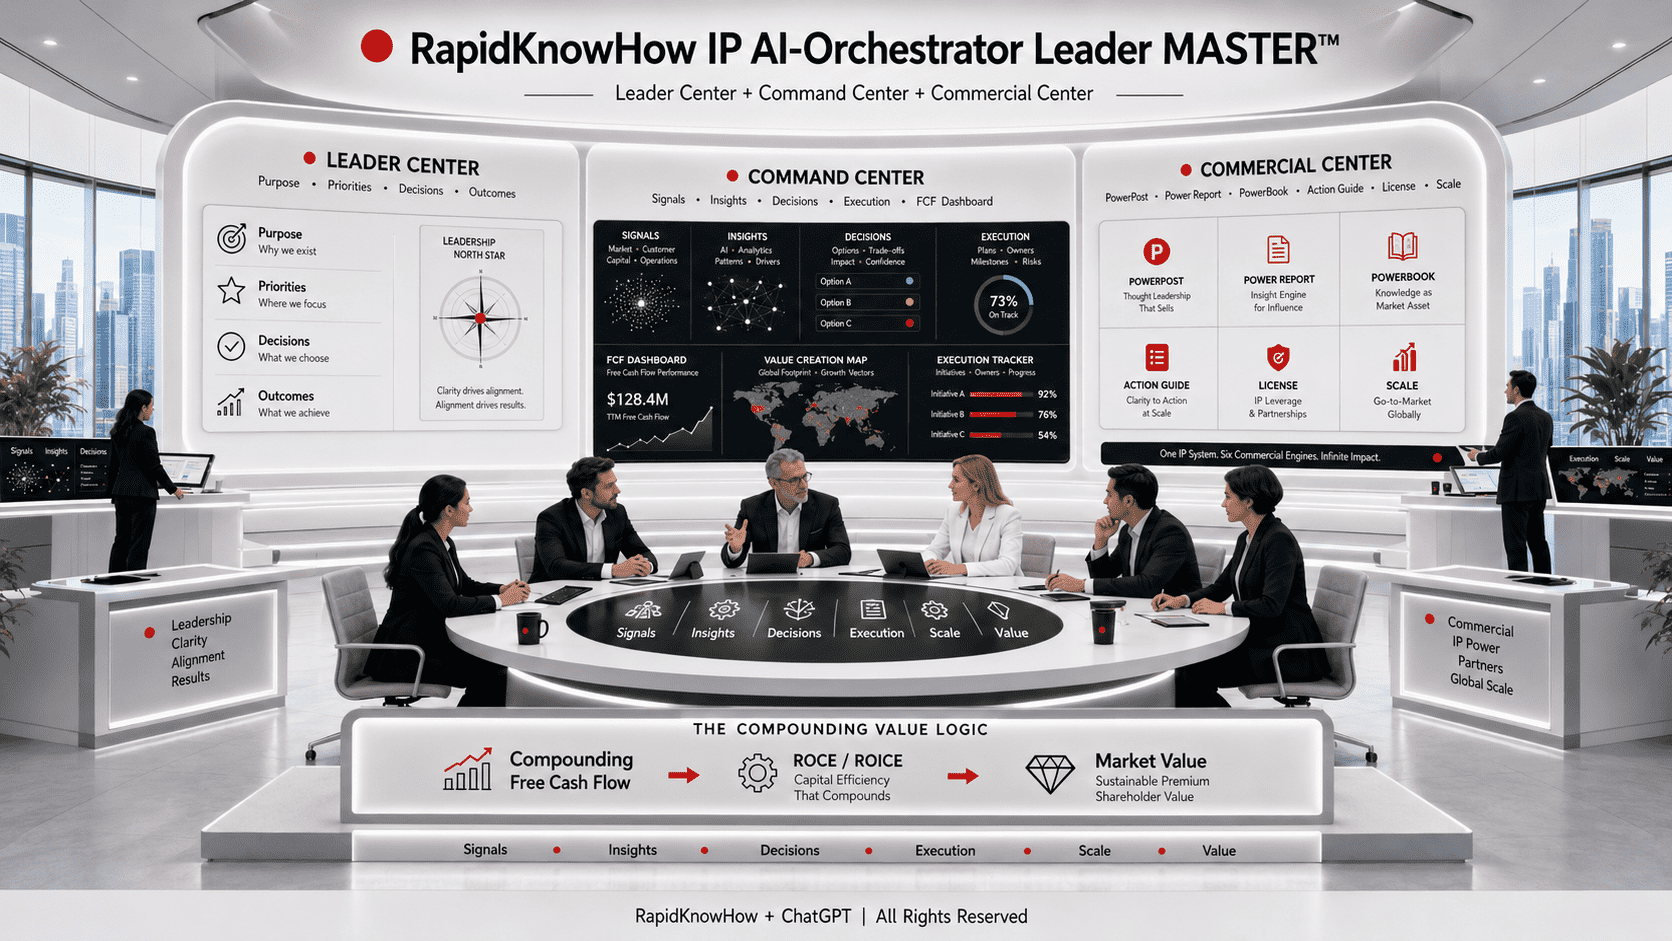
Apply RapidKnowHow’s IP MASTER Systems for making strategic decisions faster , thriving sustained free cash-flow, increasing ROCE and constantly scaling MARKET VALUE
Top 10 searches of our readers
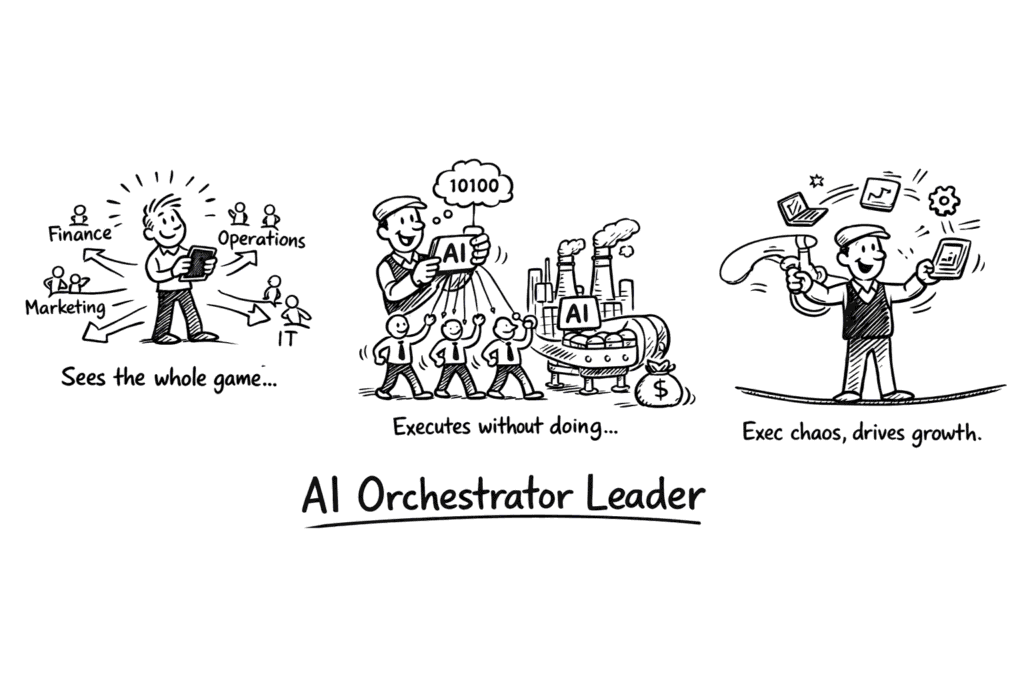
- AI-Orchestrator
- Free-Cash-Flow System
- Pricing Power
- Asset Utilization
- Customer Lock-In
- Leakage Elimination
- Supply Chain Optimization
- Cash Conversion
- Compounding Value
- Geo Command Center
The Lighthouse in the Chaos
For Leaders, Owners, Boards, and CxOs when capital, risk, and time collide.
Calm decisions outperform clever debates.
When RapidKnowHow Is Relevant
RapidKnowHow is relevant:
- When a large irreversible investment is on the table
- When margins erode faster than pricing can react
- When energy or inflation shocks hit operations
- When supply chains become fragile overnight
- When geopolitics affects business before forecasts do
- When growth hides declining ROCE
- When decisions slow down under pressure
- When risk concentration is no longer theoretical
If none of these apply, this is not for you.
Select the Situation You Are Facing
- Capital Decision
- Margin & Energy Shock
- Supply Chain Disruption
- Geopolitical Exposure
- Decision Bottleneck
- Risk Concentration
“You don’t need more information.
You need a better decision system — faster.”
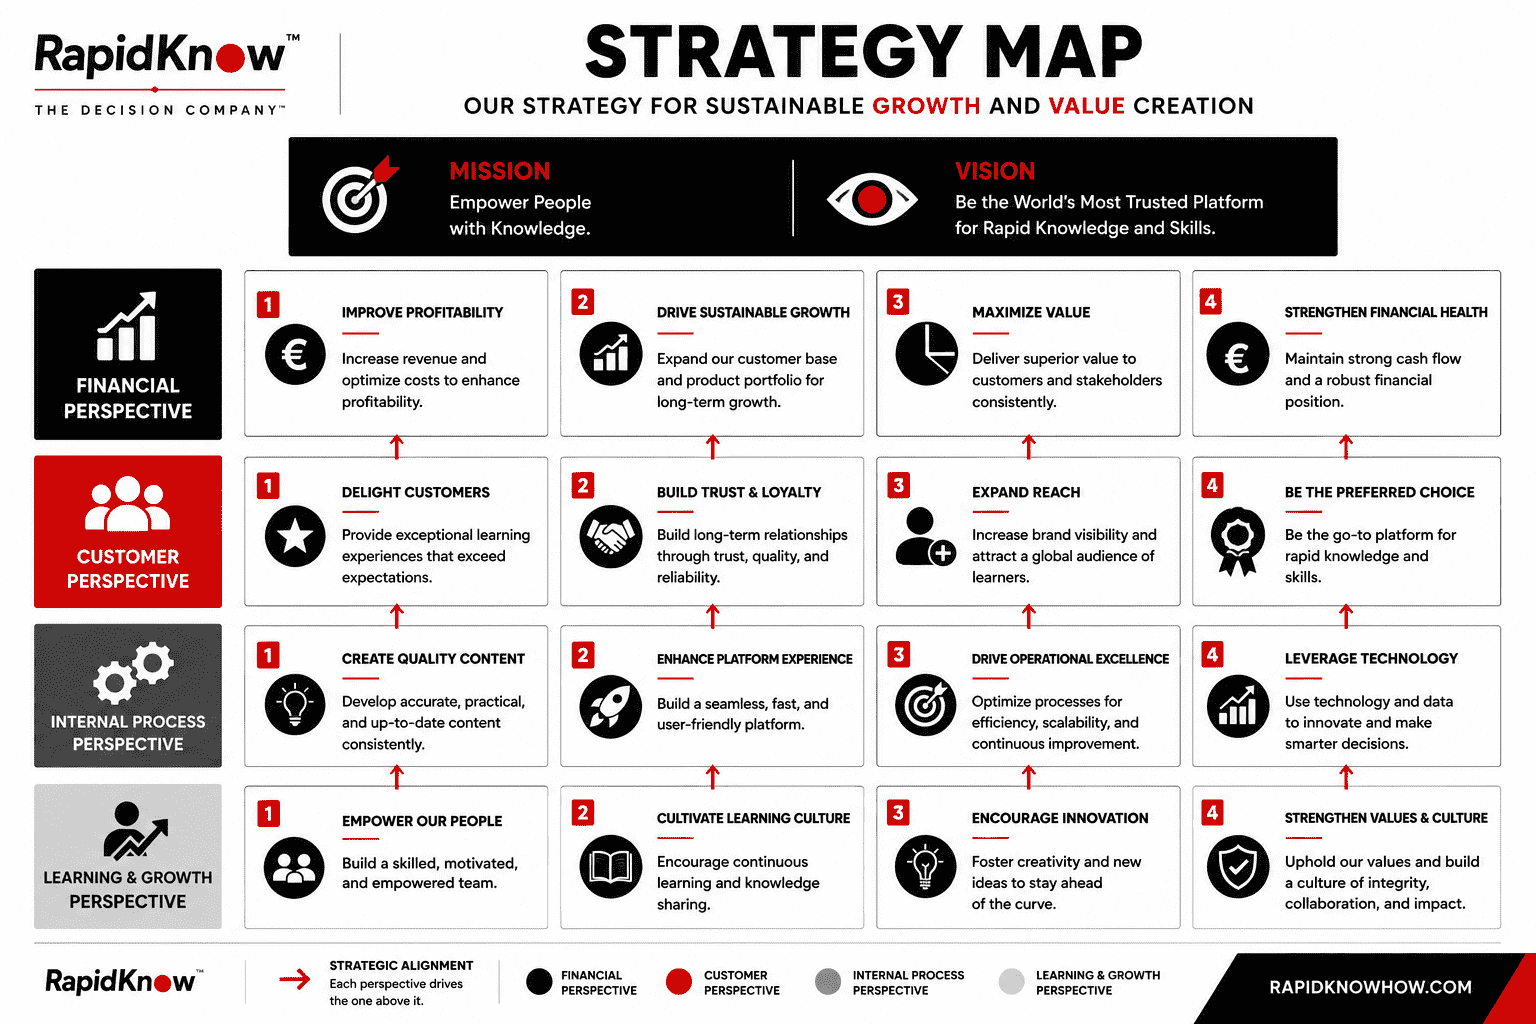
The RapidKnowHow Board Decision Operating System
RapidKnowHow applies a fixed decision discipline to navigate critical situations calmly.
The system consists of ten canonical Strategy Maps (A1–A10), each linked to:
- a Value Tree
- a 1-Page Action Guide
- a Decision Dashboard
The system is stable, finite, and designed for real decisions — not discussion.
The system is fixed. It does not adapt to opinions.
The RapidKnowHow – Lighthouse System
BC = Real-Life Business Cases in turbulent times
BC1: Utilization vs Assets
BC2: Speed vs Margin Erosion
BC3: Decision Bottleneck
BC4: Supply Chain Fragility
BC5: Risk Concentration
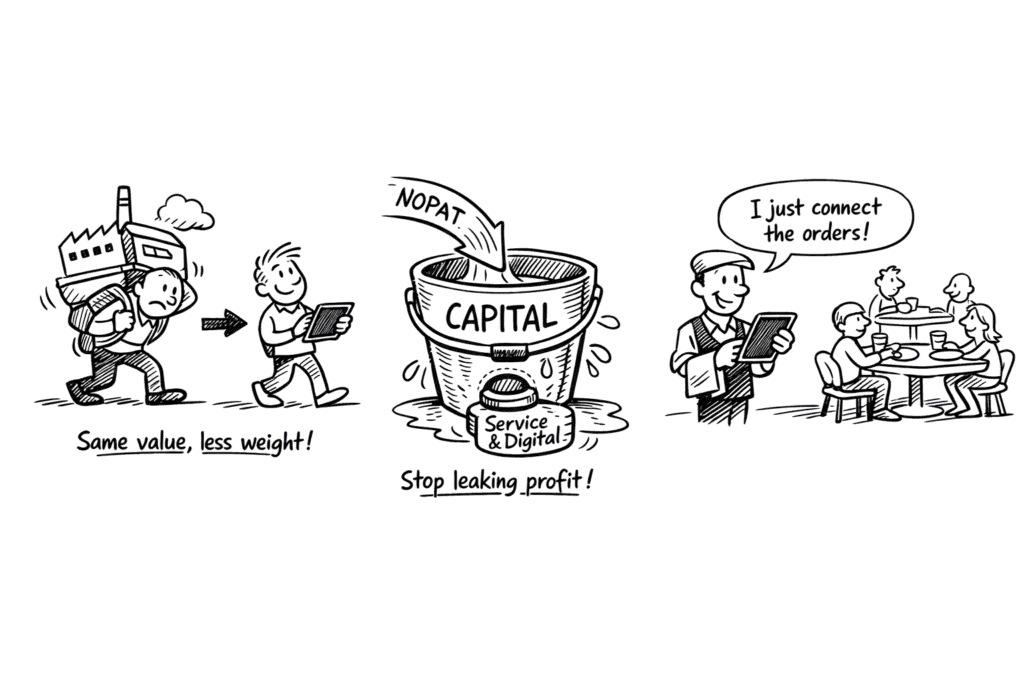
BC6: Service & Digital Shift
BC7: Geo Exposure
BC8: EVA (Economic Value Added) Expansion
BC9: ROCE Drivers
BC10: Compounding Lifetime & Generation Engine
Together they cover every critical failure mode and advantage lever every leader face in stormy environments: capital utilization. time pressure. governance management. continuity. downside risks. growth scenarios. geographical exposure. value creation & capture. operation efficiency. long-term advantage over generations.
How Decisions Are Made in Storms
- Crisis Board Meeting
- Owner-only Pre-Board Meeting
- Storm → Decision → Outcome
These are decisions made aligned to real-life situations.
RapidKnowHow is not a consulting service, a coaching offer, or a content platform.
Access is relevant only when a real decision is active.
If a real decision is active, write: josefdvd00@gmail.com

RapidKnowHow protects, releases, and accelerates free cash flow by preventing irreversible decision errors – and compounds that advantage over time