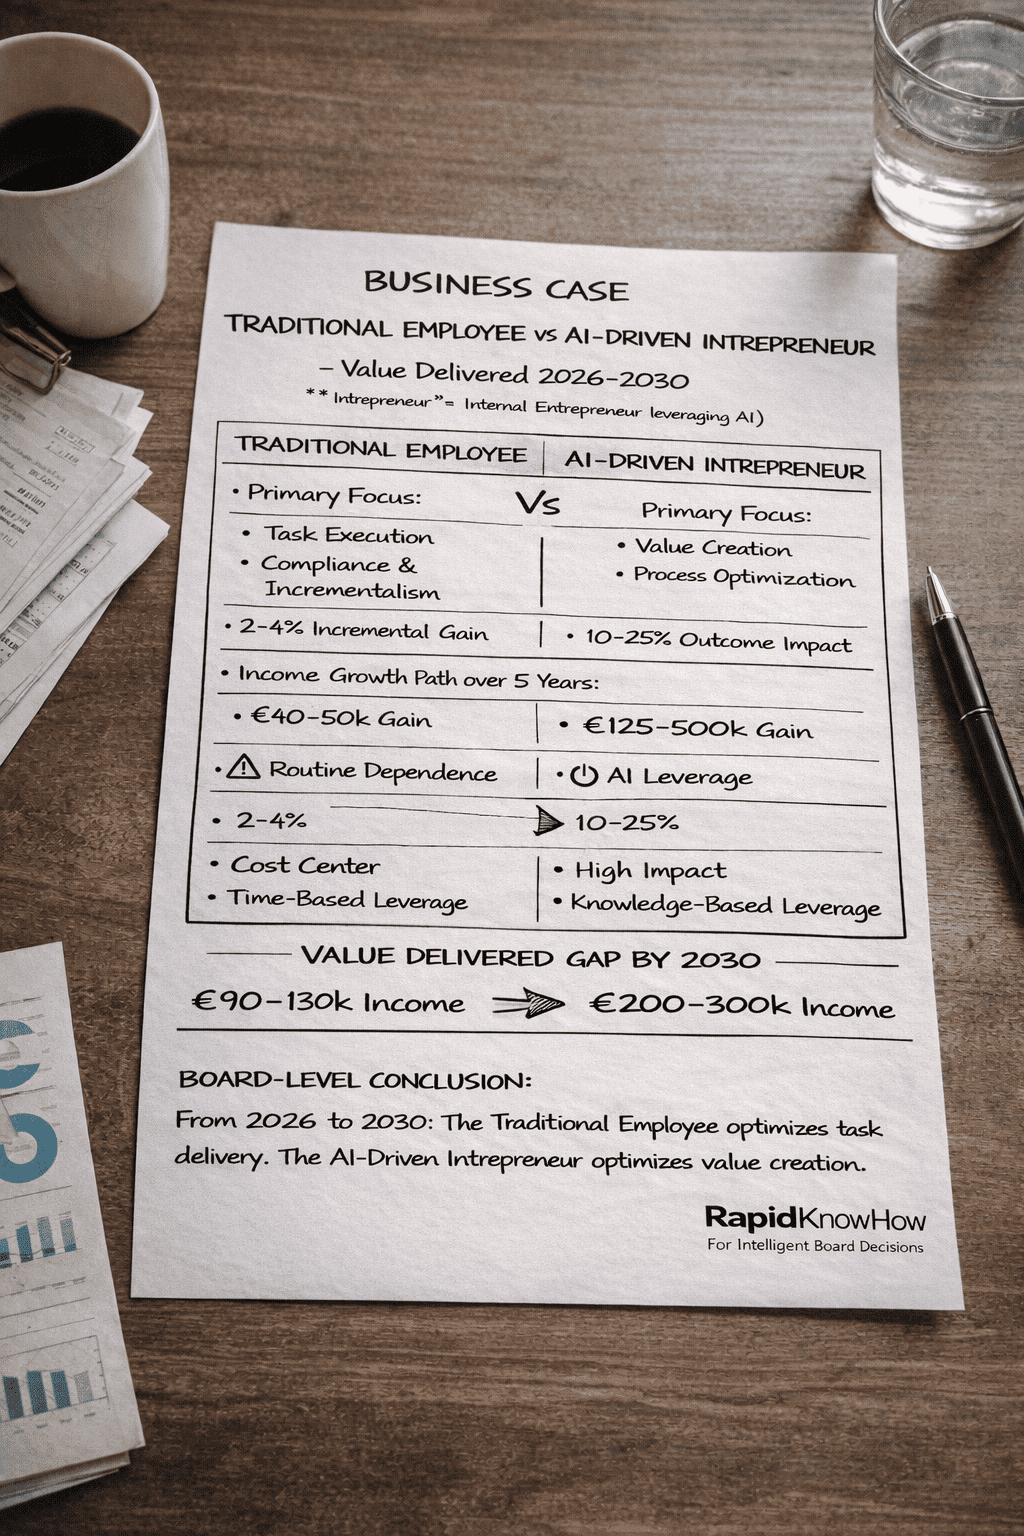
Value Delivered 2026–2030
(“Intrepreneur” = Internal Entrepreneur leveraging AI)
A) STRATEGIC ARCHETYPES
1️⃣ Traditional Employee
Primary Focus:
- Task execution
- Job description compliance
- Hours worked
- Performance review targets
Value Logic:
Input-based compensation.
Income growth path:
2–4% annual increment.
Risk:
- Replaceable
- Role automation exposure
- Limited leverage
- Dependent on hierarchy
2️⃣ AI-Driven Intrepreneur
Primary Focus:
- Value creation
- Process optimization
- Revenue acceleration
- Cost compression
- Decision speed improvement
Value Logic:
Outcome-based leverage.
Tools:
- AI signal processing
- Workflow automation
- Scenario simulation
- KPI dashboard orchestration
- Knowledge compounding
Income growth path:
10–25% annual growth potential
(or bonus, equity, profit-share)
B) BASELINE PROFILE (ILLUSTRATIVE)
Assume:
Salary 2026 = €80,000
Company revenue per employee = €400,000
EBITDA contribution per employee = €100,000
C) VALUE CREATION TRAJECTORY (2026–2030)
1️⃣ Traditional Employee
Efficiency stable.
Productivity incremental.
Value impact:
0–2% incremental gain per year.
By 2030:
Contribution increases marginally
Automation risk increases.
Company view:
Cost center or stable contributor.
Income 2030:
~€88–92k.
Total 5-year incremental income:
~€40–50k gain.
2️⃣ AI-Driven Intrepreneur
Leverages AI to:
- Reduce process time 20–40%
- Improve pricing analytics
- Identify cost leakages
- Accelerate decision cycles
- Build internal knowledge assets
Value delivered:
5–15% EBITDA impact on specific unit.
If managing €5m cost base:
5% efficiency gain = €250k/year impact.
Even if 10% credited to individual influence:
€25k–50k annual value attribution.
D) FINANCIAL IMPACT COMPARISON (5-YEAR VIEW)
| Metric | Traditional Employee | AI-Driven Intrepreneur |
|---|---|---|
| Value Impact / Year | €0–10k | €25k–150k |
| Income CAGR | 2–4% | 10–25% |
| Automation Risk | Medium–High | Low |
| Strategic Visibility | Limited | High |
| Replacement Risk | Moderate | Low |
| Leverage | Time-based | Knowledge-based |
E) ROICE COMPARISON
(Return on Innovation, Convenience & Efficiency)
Traditional Employee:
ROICE ≈ 3–6%
AI-Driven Intrepreneur:
ROICE ≈ 15–30%
Because:
Knowledge scales.
Time does not.
F) ENTERPRISE PERSPECTIVE
From employer viewpoint:
Traditional Employee:
Predictable cost.
AI-Driven Intrepreneur:
Internal value accelerator.
Companies that institutionalize AI-intrepreneurship:
- Increase FCF
- Reduce volatility
- Accelerate innovation
- Retain top performers
G) MARKET VALUE LOGIC (MACRO LEVEL)
If 20% of workforce becomes AI-driven Intrepreneurs:
EBITDA margin improves 1–3%.
For a €1bn EBITDA company:
1% margin improvement = €10m.
At 15× multiple:
€150m enterprise value gain.
That is workforce-level orchestration.
H) CAREER CAPITAL COMPOUNDING
Traditional Career:
Linear growth.
AI-Driven Intrepreneur Career:
Knowledge compounds.
Network compounds.
Authority compounds.
Optionality compounds.
Result:
Higher mobility.
Higher negotiation power.
Higher equity probability.
I) STRATEGIC CONCLUSION
Traditional Employee optimizes task delivery.
AI-Driven Intrepreneur optimizes value creation.
From 2026–2030:
The gap is not job title.
It is leverage architecture.
Capital-intensive industries will reward:
Knowledge leverage.
Decision compression.
Outcome orientation.


