What are Strategy Infographics?
Strategy infographics are visual representations of information, data, or knowledge intended to present complex information quickly and clearly. They can improve cognition by utilizing graphics to enhance the human visual system’s ability to see patterns and trends.
For Career: Strategy infographics in the career context can be used to map out career paths, highlight skills and experiences, or even visualize a resume.
They can provide a clear, concise roadmap for career progression, making it easier for individuals to plan their professional growth.
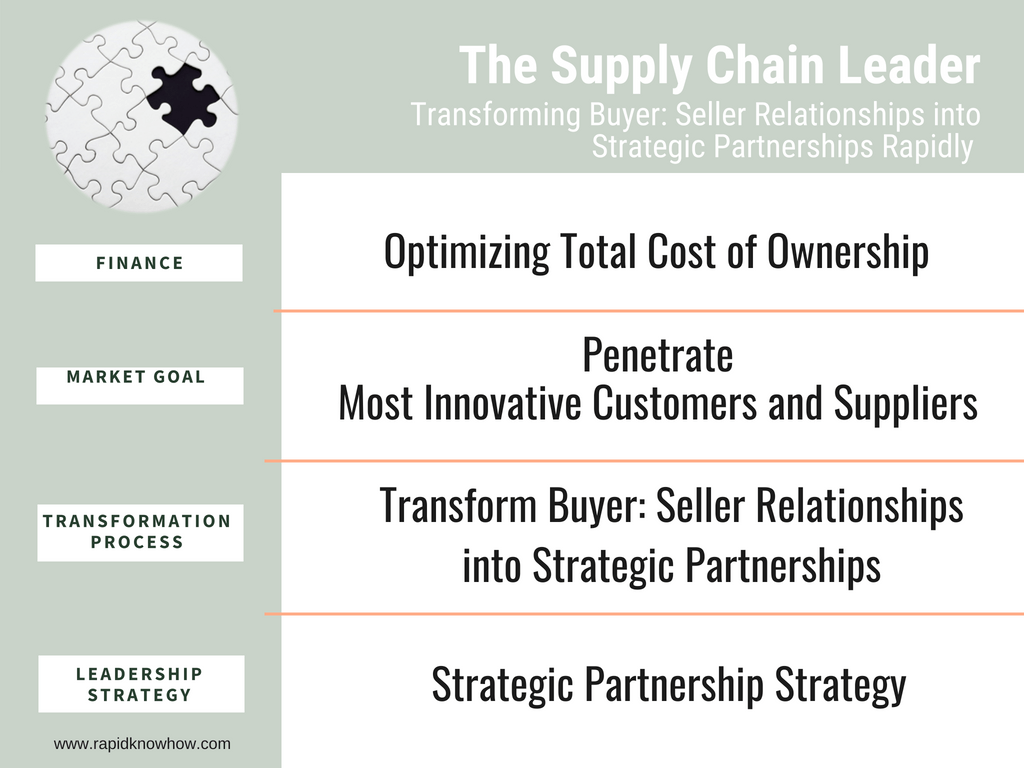
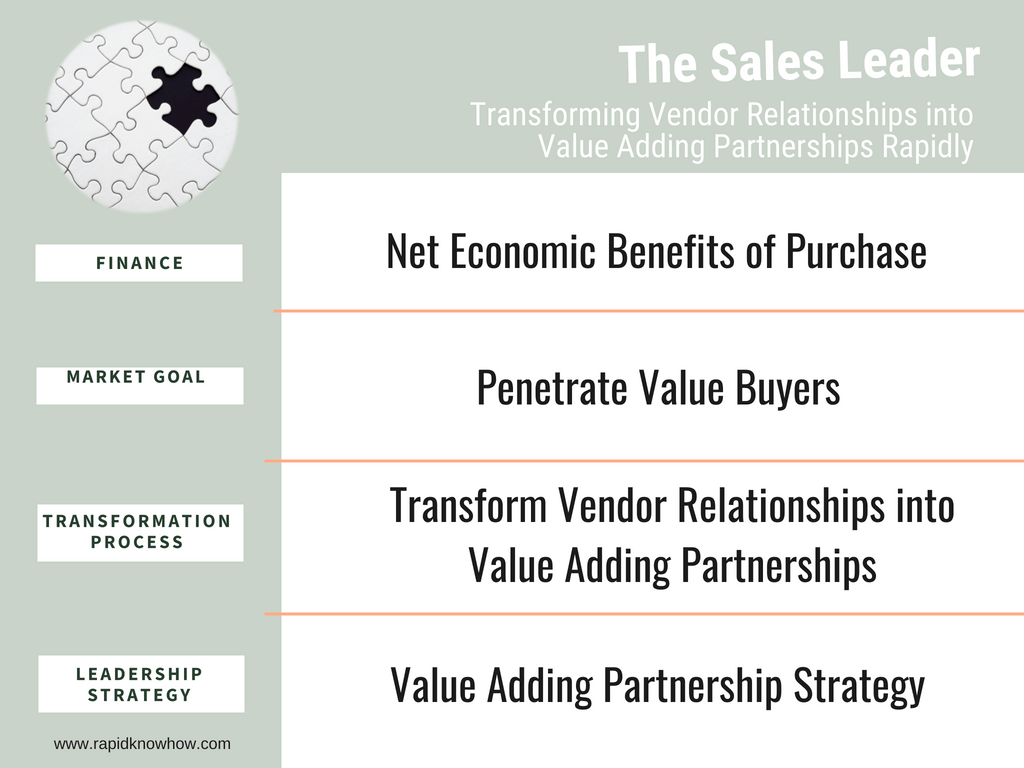
For Business: In business, strategy infographics can be used to illustrate business models, operational processes, or marketing strategies.
They can help stakeholders understand the company’s strategic direction and how different elements of the business interconnect.
For Wealth: When it comes to wealth, strategy infographics can be used to depict investment strategies, wealth distribution, or financial planning.
They can simplify complex financial concepts and make them more accessible to a broader audience.
Why We Need Strategy Infographics?
We need strategy infographics because they simplify complex information and make it easily digestible.
They are an effective communication tool that enhances understanding, retention, and recall of information. They also engage viewers through their visually appealing design and layout.
How Do We Create Strategy Infographics Step-by-Step?
1. Define Your Goals: Identify what you want your infographic to achieve.
2. Research Your Topic: Gather all the necessary data and information.
3. Choose a Template: Select a design that suits your content.
4. Visualize Your Data: Use charts, graphs, icons, etc., to represent your data.
5. Add Text: Write concise captions and headings.
6. Design Layout: Arrange elements for easy reading and comprehension.
7. Review & Edit: Check for errors and make necessary adjustments.
8. Share & Distribute: Publish your infographic where your audience can see it.
10 Examples of Strategy Infographics:
1. Business Model Canvas: A visual chart describing a company’s value proposition, infrastructure, customers, and finances.
2. SWOT Analysis: A strategic planning technique used to help a person or organization identify strengths, weaknesses, opportunities, and threats.
3. Career Pathway: A roadmap showing career progression in a particular field.
4. Investment Portfolio: A graphic representation of asset allocation.
5. Marketing Funnel: A model describing the customer journey from awareness to purchase.
6. Resume Infographic: A visual summary of a person’s skills, experiences, and achievements.
7. Financial Planning Process: An infographic outlining the steps in financial planning.
8. Organizational Structure: A diagram showing the hierarchy within an organization.
9. Product Lifecycle: A graphical representation of the stages a product goes through from conception to withdrawal from the market.
10. Wealth Distribution Chart: An infographic showing how wealth is distributed among different groups.
Conclusion:
Strategy infographics are powerful tools for simplifying complex information and enhancing communication. They can be used in various contexts, including career planning, business strategy, and wealth management.
Create Your First Strategic Infographic:
Now that you understand what strategy infographics are and how to create them, it’s time to make your own!

Remember to define your goals > research your topic thoroughly > choose an appropriate template > visualize your data effectively > add concise text
> design a clear layout > review and edit carefully, and share your infographic with your intended audience. Happy designing!