
Executive Summary
By 2030, the industrial gas industry will be defined less by physical scale and more by speed of value creation. Traditional strengths—plants, pipelines, depots, and contracts—will remain necessary but insufficient. The decisive advantage will shift toward companies that orchestrate value across the entire system in real time.
Three groups will clearly emerge:
- Leaders: AI-driven, fast, capital-efficient value orchestrators
- Laggards: partially modernized but structurally slow performers
- Losers: asset-heavy, margin-leaking, strategically delayed operators
The dividing line is simple:
👉 From operating assets → to orchestrating value
1. Industry Context: From Stability to Dynamic Pressure
Historically, industrial gas has been a highly stable, capital-intensive industry characterized by:
- Long-term contracts
- Local monopolies or oligopolies
- High switching costs
- Predictable demand in core sectors
However, the 2025–2030 period introduces structural shifts:
- Energy volatility impacts production economics
- Digitalization exposes inefficiencies
- Customer expectations shift toward service and reliability
- AI enables real-time optimization
The result:
👉 Stability remains, but performance dispersion increases dramatically
2. The New Competitive Model
The winning companies will adopt a fundamentally different operating logic:
Traditional Model:
Plan → Execute → Review
2030 Model:
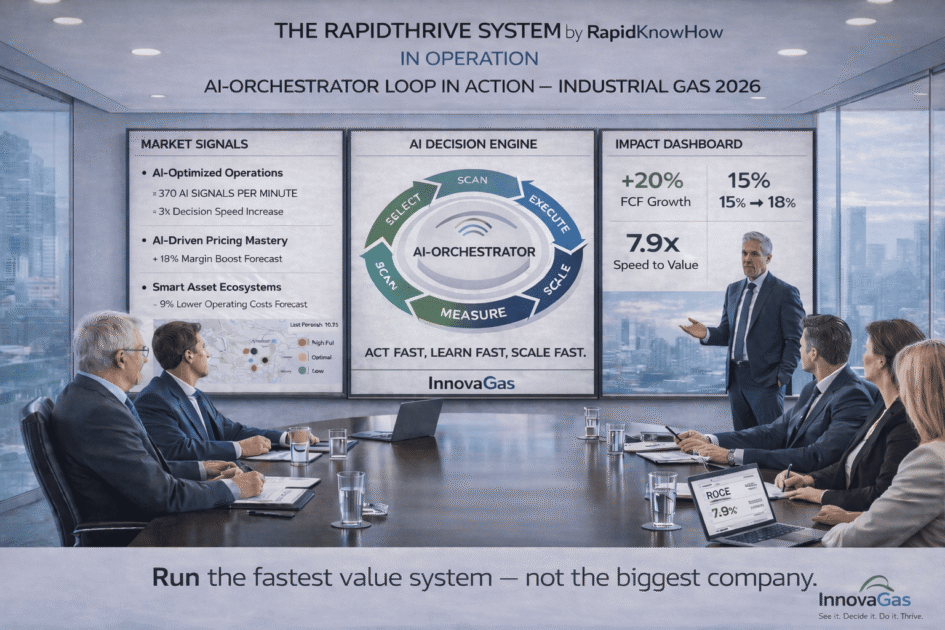
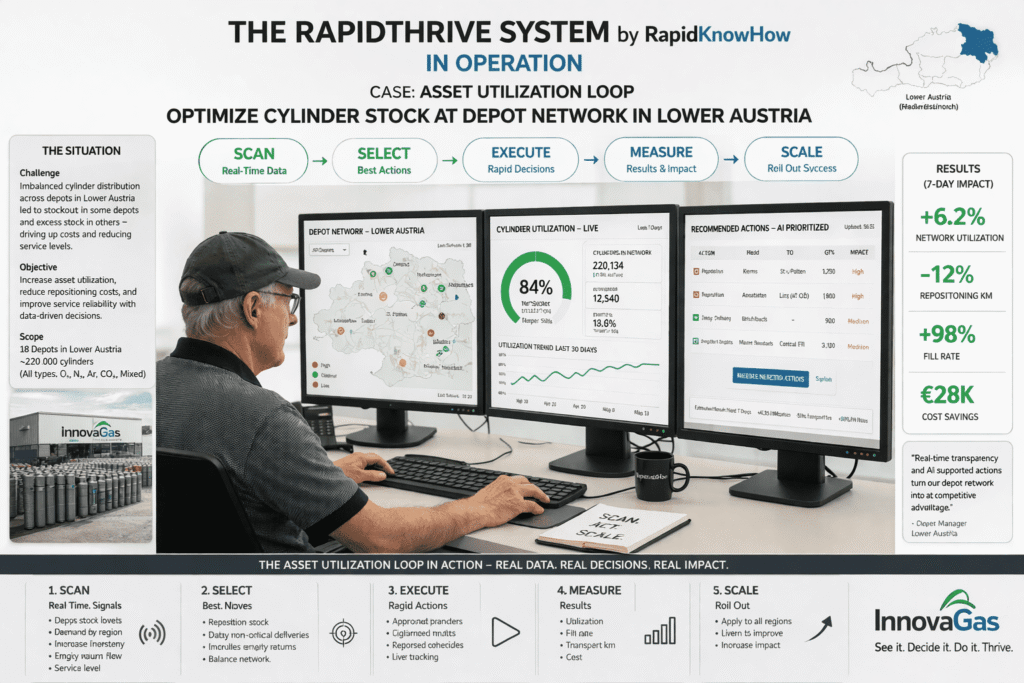
Scan → Decide → Execute → Measure → Adapt (continuous loop)
This shift transforms industrial gas into a dynamic system, not a static operation.
3. The Leaders (2030)
Leaders will dominate through five core capabilities:
1. AI-Orchestrated Operations
They connect the entire value chain:
- supply
- production
- distribution
- pricing
- service
👉 No silos. One system.
2. Real-Time Decision Speed
Leaders act on live signals:
- depot imbalances
- cylinder utilization
- pricing gaps
- customer demand changes
👉 Advantage = time-to-action
3. Asset Productivity Excellence
Leaders treat assets as financial instruments, not just equipment.
They optimize:
- cylinder turnover
- depot stock levels
- route density
- tank utilization
👉 Result: higher ROCE
4. Pricing Discipline
They implement structured pricing systems:
- dynamic pricing
- segment-based margins
- energy pass-through logic
👉 Result: consistent FCF growth
5. Customer Lock-In Systems
Leaders move beyond product delivery:
- telemetry-enabled tanks
- automatic replenishment
- integrated workflows
👉 Result: recurring revenue + high switching costs
Leader Outcome
- FCF ↑
- ROCE ↑
- Speed ↑
- Market Value ↑
4. The Laggards (2030)
Laggards will remain operationally solid but strategically limited.
Key Characteristics
1. Fragmented Digitalization
Multiple tools, no unified system.
2. Delayed Decision Cycles
Still driven by weekly/monthly reporting.
3. Inconsistent Pricing
Margins vary widely across accounts.
4. Asset Blind Spots
Limited visibility on true asset productivity.
5. Legacy Protection
Reluctance to redesign outdated structures.
Laggard Outcome
- Moderate profitability
- Increasing inefficiency
- Declining competitive positioning
👉 They survive—but fall behind.
5. The Losers (2030)
Losers will be those who fail to adapt structurally.
Critical Failure Patterns
1. Commodity Thinking
Focus on volume instead of value.
2. No AI Integration
Digital remains superficial, not operational.
3. Margin Leakage
Weak pricing discipline destroys profitability.
4. Idle Capital
Underutilized assets reduce return.
5. Weak Customer Integration
Transactional relationships instead of embedded services.
Loser Outcome
- Declining margins
- Falling ROCE
- Loss of customers
- Reduced valuation
👉 Ultimately: strategic irrelevance
6. The 5 Strategic Battlefields
The competition toward 2030 will focus on five areas:
1. Depot & Cylinder Optimization
Who balances supply and demand fastest?
2. Pricing Intelligence
Who protects margin daily?
3. Asset Turnover
Who extracts more value per asset?
4. Customer Integration
Who becomes indispensable to customers?
5. Capital Allocation
Who invests in high-return loops?
7. The Core Metric System
The winning companies align around three metrics:
- FCF (Free Cash Flow) → cash generation
- ROCE (Return on Capital Employed) → capital efficiency
- Speed to Value → execution advantage
👉 Together, they define market leadership
8. Final Strategic Insight
The biggest mistake in this industry is believing:
👉 “We are strong because we are big.”
The reality in 2030:
👉 You are strong only if you are fast, precise, and capital-efficient.
Final CEO Message
👉 “Do not optimize your operations.
Optimize your value creation system.”
RapidKnowHow Summary
👉 “The fastest system wins—not the biggest company.” – Josef David
Leave a Reply
You must be logged in to post a comment.