
The E-Car Boom 2026 is not uniform globally. It follows a clear geographic pattern driven by policy, industrial capacity, charging infrastructure, and battery supply chains. Below is a Strategic Market Signal Map showing where the boom is strongest.
A) Global EV Boom by Continent (2026 Signal)
1. Asia – Dominant Growth Engine
- Largest EV market globally.
- China alone accounts for ~50% of global EV sales.
- Strong battery supply chain and lower-cost EV models.
Key Regions
- China (global center of EV production)
- Southeast Asia (emerging demand)
- South Korea / Japan (technology leaders)
Strategic Signal
➡ Asia = Scale + manufacturing dominance
2. Europe – Fast Policy-Driven Adoption
Europe is the second-largest EV market, with EVs reaching about 19–20% of new car sales in early 2026.
Key Regions
- Northern Europe
- Western Europe
- EU urban regions
Strategic Signal
➡ Europe = regulation-driven transition
3. North America – Moderate but Strategic Growth
The EV transition is slower but still significant.
Key Regions
- U.S. West Coast
- Canada
- Mexico (production hub)
Strategic Signal
➡ North America = technology + platform competition
4. Southeast Asia – New EV Expansion Zone
Several countries are moving rapidly due to industrial policy and Chinese EV expansion.
Examples:
- Vietnam (~40% EV share emerging markets)
- Thailand (>20% EV share in 2025)
- Indonesia (~15%)
Strategic Signal
➡ ASEAN = next EV growth frontier
5. Latin America – Early Stage but Accelerating
Leading markets include:
- Uruguay (~27% EV share)
- Costa Rica (~17%)
Strategic Signal
➡ Small markets but fast adoption due to renewable power
B) Top EV Regions in the World (2026)
| Rank | Region | Strategic Role |
|---|---|---|
| 1 | China | Global EV industrial ecosystem |
| 2 | EU (Germany, France, Netherlands) | Policy-driven market |
| 3 | Scandinavia | Highest adoption globally |
| 4 | United States | Technology & premium EV market |
| 5 | Southeast Asia | New mass-growth zone |
C) Leading Countries in the EV Boom (2026)
Tier 1 – Global Leaders
- China – largest EV market and producer
- Norway – ~97% EV share of new car sales
Tier 2 – Rapid Adopters
- Sweden
- Denmark
- Netherlands
- Germany
- United Kingdom
Tier 3 – Emerging EV Growth
- Vietnam
- Thailand
- Indonesia
- Singapore
- India (early stage)
D) Strategic Insight for Investors & Industry
Three EV Power Zones 2026
1️⃣ China EV Supercluster
- Batteries
- Vehicles
- Supply chains
2️⃣ European Regulation Market
- CO₂ targets
- EV subsidies
- infrastructure
3️⃣ US Tech Platform Market
- Tesla
- software-defined vehicles
- autonomous mobility
✅ Key Market Signal
The EV boom is not global everywhere.
It concentrates in three dominant corridors:
China → Europe → North America
These regions drive most of the 20+ million EVs sold annually worldwide.
✅ Strategic Takeaway (RapidKnowHow Style)
EV Boom = Policy + Batteries + Infrastructure
Where these three exist together → EV adoption explodes.
Market Signal : E-Car Boom 2026 in which Continents, Regions and Countries
The E-Car Boom 2026 is not uniform globally. It follows a clear geographic pattern driven by policy, industrial capacity, charging infrastructure, and battery supply chains. Below is a Strategic Market Signal Map showing where the boom is strongest.
A) Global EV Boom by Continent (2026 Signal)
1. Asia – Dominant Growth Engine
- Largest EV market globally.
- China alone accounts for ~50% of global EV sales.
- Strong battery supply chain and lower-cost EV models.
Key Regions
- China (global center of EV production)
- Southeast Asia (emerging demand)
- South Korea / Japan (technology leaders)
Strategic Signal
➡ Asia = Scale + manufacturing dominance
2. Europe – Fast Policy-Driven Adoption
Europe is the second-largest EV market, with EVs reaching about 19–20% of new car sales in early 2026.
Key Regions
- Northern Europe
- Western Europe
- EU urban regions
Strategic Signal
➡ Europe = regulation-driven transition
3. North America – Moderate but Strategic Growth
The EV transition is slower but still significant.
Key Regions
- U.S. West Coast
- Canada
- Mexico (production hub)
Strategic Signal
➡ North America = technology + platform competition
4. Southeast Asia – New EV Expansion Zone
Several countries are moving rapidly due to industrial policy and Chinese EV expansion.
Examples:
- Vietnam (~40% EV share emerging markets)
- Thailand (>20% EV share in 2025)
- Indonesia (~15%)
Strategic Signal
➡ ASEAN = next EV growth frontier
5. Latin America – Early Stage but Accelerating
Leading markets include:
- Uruguay (~27% EV share)
- Costa Rica (~17%)
Strategic Signal
➡ Small markets but fast adoption due to renewable power
B) Top EV Regions in the World (2026)
| Rank | Region | Strategic Role |
|---|---|---|
| 1 | China | Global EV industrial ecosystem |
| 2 | EU (Germany, France, Netherlands) | Policy-driven market |
| 3 | Scandinavia | Highest adoption globally |
| 4 | United States | Technology & premium EV market |
| 5 | Southeast Asia | New mass-growth zone |
C) Leading Countries in the EV Boom (2026)
Tier 1 – Global Leaders
- China – largest EV market and producer
- Norway – ~97% EV share of new car sales
Tier 2 – Rapid Adopters
- Sweden
- Denmark
- Netherlands
- Germany
- United Kingdom
Tier 3 – Emerging EV Growth
- Vietnam
- Thailand
- Indonesia
- Singapore
- India (early stage)
D) Strategic Insight for Investors & Industry
Three EV Power Zones 2026
1️⃣ China EV Supercluster
- Batteries
- Vehicles
- Supply chains
2️⃣ European Regulation Market
- CO₂ targets
- EV subsidies
- infrastructure
3️⃣ US Tech Platform Market
- Tesla
- software-defined vehicles
- autonomous mobility
✅ Key Market Signal
The EV boom is not global everywhere.
It concentrates in three dominant corridors:
China → Europe → North America
These regions drive most of the 20+ million EVs sold annually worldwide.
✅ Strategic Takeaway
EV Boom = Policy + Batteries + Infrastructure
Where these three exist together → EV adoption explodes.
Below is the RapidKnowHow Strategic Interpretation of the Global EV Boom Map 2026 so leaders can understand the signal in 60 seconds.
A) EV Boom Hotspots 2026
🇨🇳 China – Global EV Epicenter
Role: Production + Market + Battery ecosystem
Key drivers
• BYD, SAIC, Geely scale production
• CATL global battery leadership
• strong state policy
Signal:
➡ China dominates EV manufacturing + supply chains
🇪🇺 Northern & Western Europe – Policy Driven Adoption
Leading countries
• Norway
• Sweden
• Netherlands
• Germany
• United Kingdom
Drivers
• strict CO₂ rules
• subsidies
• dense charging infrastructure
Signal:
➡ Europe is the fastest transition region
🇺🇸 United States – Technology Driven Market
Hot regions
• California
• Texas
• Northeast corridor
Drivers
• Tesla ecosystem
• software-defined vehicles
• IRA subsidies
Signal:
➡ US leads innovation platforms
B) Emerging EV Growth Regions
🇻🇳 🇹🇭 🇮🇩 Southeast Asia
Drivers
• Chinese EV investment
• new battery plants
• urban electrification
Signal
➡ Next mass-growth zone
🇮🇳 India
Drivers
• government electrification policy
• two-wheel EV dominance
Signal
➡ Huge future demand
🇧🇷 🇲🇽 Latin America
Drivers
• urban pollution reduction
• EV fleet electrification
Signal
➡ Emerging regional adoption
C) Strategic Supply Chain Map
The EV boom is controlled by three strategic layers
1 Battery Materials
- Lithium → Chile / Australia
- Nickel → Indonesia
- Cobalt → Congo
2 Battery Production
- China
- South Korea
- Japan
3 Vehicle Manufacturing
- China
- Europe
- United States
D) RapidKnowHow Strategic Signal
EV Market Power Triangle
China        Europe        USA
Production   Regulation    Technology
SupplyChain  Demand        Platforms
Together these three regions drive ~85–90% of the global EV transformation.
E) CEO Strategic Insight
Industries benefiting most from the EV boom:
1️⃣ Batteries
2️⃣ Power electronics
3️⃣ Charging infrastructure
4️⃣ Industrial gases (hydrogen, specialty gases for semiconductors & batteries)
5️⃣ Energy grid systems
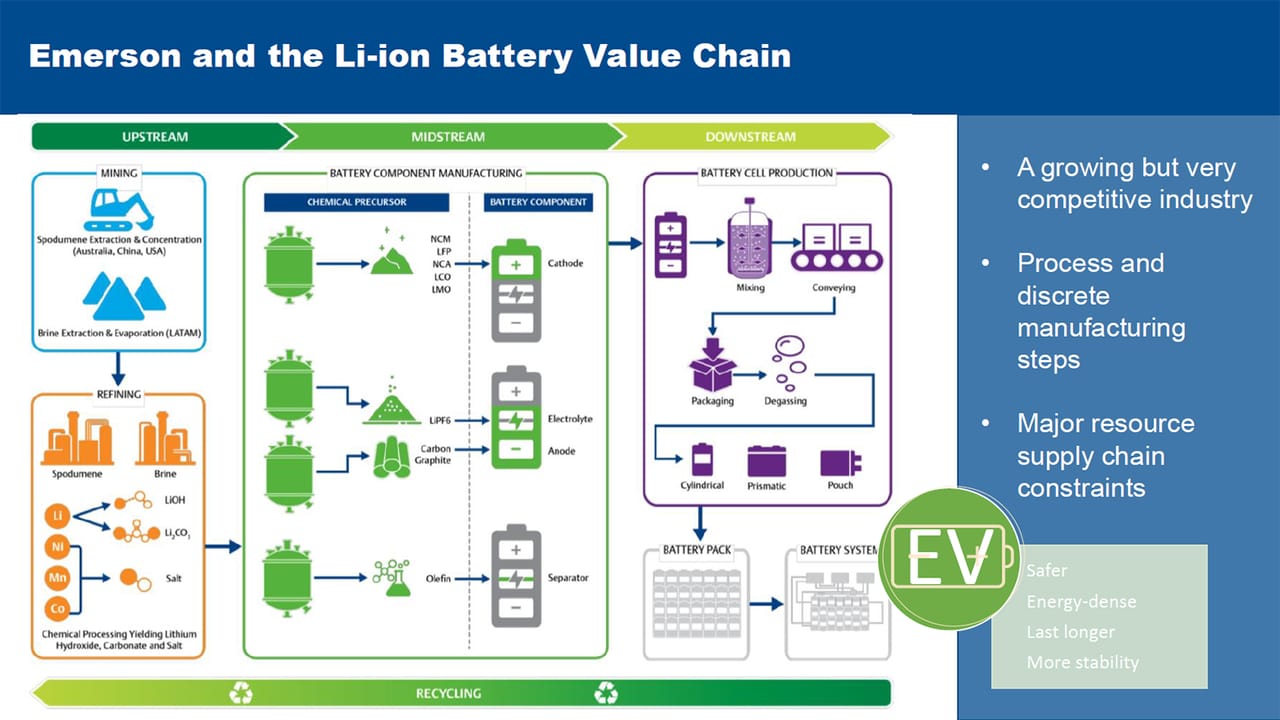
EV Value Chain Opportunity Map 2026
(Where Industrial Gas Companies Capture Value)

Below is the RapidKnowHow Strategic Interpretation for leaders in Industrial Gases to quickly see where value is captured in the EV boom.
A) EV Value Chain (5 Strategic Stages)
1️⃣ Raw Materials Mining
Key materials
• Lithium
• Nickel
• Cobalt
• Graphite
Main countries
• Australia
• Chile
• Indonesia
• Congo
Industrial Gas Opportunity
- Oxygen for smelting
- Nitrogen for inert environments
- Hydrogen for metal reduction
2️⃣ Materials Refining & Chemical Processing
Processes
• lithium refining
• cathode chemicals
• electrolyte production
Main regions
• China
• South Korea
• Japan
Industrial Gas Opportunity
Critical gases:
• Hydrogen
• Nitrogen
• Oxygen
• Argon
Used for
- chemical synthesis
- purification
- process stability
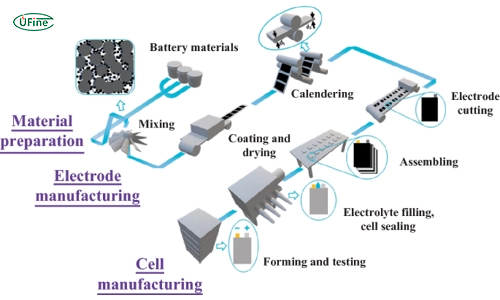
3️⃣ Battery Cell Manufacturing (Gigafactories)
Key players
• CATL
• BYD
• LG Energy Solution
• Panasonic
• Northvolt
Major locations
• China
• Europe (Germany, Sweden, Poland)
• United States
Industrial Gas Opportunity
Very large consumption:
• Nitrogen (dry rooms)
• Argon (welding)
• Specialty gases for electronics
Gigafactories are major long-term gas customers.
4️⃣ EV Manufacturing
Key manufacturers
• Tesla
• BYD
• Volkswagen
• Hyundai
• Stellantis
Industrial Gas Opportunity
- welding gases
- laser cutting gases
- heat treatment gases
5️⃣ Charging Infrastructure & Energy Systems
Components
• power electronics
• semiconductors
• grid equipment
Industrial Gas Opportunity
- ultra-high purity gases for semiconductor fabrication
- hydrogen for energy storage
B) Strategic Global EV Industrial Clusters
🇨🇳 China
World leader in
• batteries
• EV manufacturing
• supply chains
Industrial gas demand very high.
🇪🇺 Europe
New gigafactory corridor
• Germany
• Sweden
• Poland
• Hungary
Rapid growth in battery plants.
🇺🇸 North America
Gigafactory expansion
• Texas
• Nevada
• Tennessee
Strong growth in EV production plants.
C) Industrial Gas Strategic Signal
The EV boom = Gigafactory boom.
Each gigafactory requires:
• massive nitrogen supply
• argon welding gases
• specialty gases
• hydrogen
Meaning:
➡ Industrial gas demand grows strongly with battery manufacturing.
D) RapidKnowHow CEO Strategic Insight
Industrial gas companies that position early in EV battery clusters will capture long-term contracts.
Key strategy:
1️⃣ Identify new gigafactories early
2️⃣ Secure long-term gas supply contracts
3️⃣ build on-site production units
Result
Stable cash flow for 15–25 years.
✔ Strategic Takeaway
EV boom → battery boom → industrial gas demand boom. – Josef David
Global gigafactory watchlist 2026 — Industrial Gas opportunity view
1) LG Energy Solution Wrocław — Biskupice Podgórne, Poland
Capacity: 86 GWh. Public output signal: about 700,000 EV batteries/year, with a stated goal of 1 million batteries/year.
Indicative 2026 utilization: high / mature.
Industrial gases demand: very high nitrogen for dry rooms and safe handling; argon for coating/sintering/inert steps; some oxygen/hydrogen in adjacent materials processing.
Likely supply mode: bulk liquid + on-site nitrogen generation, with packaged gases for specialty needs.
Value proposition for gas supplier: one of Europe’s largest cell plants, so it fits long-term base-load nitrogen contracts, redundancy systems, telemetry, and purity assurance.
2) CATL Debrecen — Debrecen, Hungary
Capacity: planned 100 GWh, with 40 GWh initial annual capacity for the first stage and cell production scheduled to start in early 2026.
Public output signal: plant reported as fully booked by clients before launch.
Indicative 2026 utilization: low-to-mid / commissioning-ramp.
Industrial gases demand: very high nitrogen from day one; argon and other process gases rise with ramp-up.
Likely supply mode: bulk liquid in early ramp, then migration toward on-site generation / dedicated supply as volumes stabilize.
Value proposition: a classic anchor-account opportunity for industrial gases with room to scale over multiple phases.
3) CATL Arnstadt — Thuringia, Germany
Capacity: initial permitted 8 GWh, with planned expansion to 14 GWh; module production started earlier and cell production began in Germany in 2022.
Indicative 2026 utilization: mid / ramping.
Industrial gases demand: high nitrogen, plus argon and specialty gases tied to cell and module operations.
Likely supply mode: bulk liquid + packaged specialty gases, with on-site options depending on expansion pace.
Value proposition: smaller than Debrecen, but strategically attractive because it is already operating and located inside the German auto corridor.
4) Samsung SDI Göd — Göd, Hungary
Capacity: around 40 GWh annual capacity. Public output signal: enough for roughly 600,000 mid-sized EVs.
Indicative 2026 utilization: mid-to-high / mature-ramp.
Industrial gases demand: high nitrogen, argon, and process gases for prismatic-cell manufacturing.
Likely supply mode: bulk liquid + pipeline or dedicated local supply, with packaged specialty gases.
Value proposition: a strong recurring-load customer where gas suppliers can sell reliability, purity, backup storage, and digital monitoring.
5) Lyten / former Northvolt Ett — Skellefteå, Sweden
Installed capacity cited in the February 2026 acquisition: 16 GWh existing battery manufacturing capacity. Northvolt had also said the previously planned expansion was suspended in 2024.
Indicative 2026 utilization: uncertain / under transition.
Industrial gases demand: still high where lines are running, especially nitrogen and argon.
Likely supply mode: bulk liquid + packaged gases, with supply flexibility especially important because ownership and operating scope changed.
Value proposition: good example of why gas suppliers value resilient contracts, take-or-pay structure, and operational flexibility.
6) ACC Billy-Berclau/Douvrin — Hauts-de-France, France
Original public target: 40 GWh at full capacity for the site, but Reuters reported in February 2026 that ACC had scaled back German and Italian plans and that the French plant would run two blocks with higher installed capacities of 13 GWh and 15 GWh.
Indicative 2026 utilization: mid / industrial ramp.
Industrial gases demand: high nitrogen, argon, and supporting gases for drying, coating, and assembly.
Likely supply mode: bulk liquid, then increasingly dedicated / on-site as production stabilizes.
Value proposition: a French auto-backed customer where the gas supplier can win by bundling supply security + engineering support.
7) Panasonic Energy — Sparks, Nevada, USA
Capacity: Panasonic says Sparks has capacity of over 30 GWh; Tesla says Gigafactory Nevada is producing 37 GWh+ annually in battery cells. Panasonic also says the site has delivered 11 billion+ cells.
Indicative 2026 utilization: high / mature.
Industrial gases demand: very high and stable, especially nitrogen and argon.
Likely supply mode: bulk liquid, possibly dedicated local production / long-term supply, plus packaged specialty gases.
Value proposition: one of the best examples of steady, large-volume, low-churn gas demand.
8) Panasonic Energy — De Soto, Kansas, USA
Capacity: 32 GWh planned annual production capacity; mass production began in July 2025. Panasonic said its two U.S. plants together lift U.S. capacity to about 73 GWh/year.
Indicative 2026 utilization: mid / ramping upward.
Industrial gases demand: very high nitrogen as lines stabilize; argon and specialty gases increase with yield optimization.
Likely supply mode: bulk liquid at launch, with scope for on-site nitrogen if ramp continues strongly.
Value proposition: attractive for suppliers because new plants typically need commissioning support, backup logistics, and process optimization services.
9) Ultium Cells Warren — Warren/Lordstown, Ohio, USA
Capacity: more than 45 GWh annual production capacity.
Indicative 2026 utilization: mid-to-high / scaling.
Industrial gases demand: very high nitrogen, plus argon and support gases across electrode and cell manufacturing.
Likely supply mode: bulk liquid + dedicated storage, potentially moving to more embedded supply architecture as volume rises.
Value proposition: large-format EV cell production means high base-load demand and strong service revenue around storage, telemetry, and uptime.
10) SK Battery America — Commerce, Georgia, USA
Capacity: about 22 GWh annual capacity, enough for around 300,000 EVs; production began in 2022.
Indicative 2026 utilization: mid / established-ramp.
Industrial gases demand: high nitrogen, plus argon and packaged specialty gases.
Likely supply mode: bulk liquid + packaged, with on-site nitrogen possible depending on expansion and adjacent plants.
Value proposition: strong fit for gas suppliers targeting the U.S. Southeast EV corridor.
Industrial-gases demand, supply modes, and value proposition — the practical pattern
1. Demand pattern by factory size
A battery gigafactory’s most important gas is usually nitrogen, because dry rooms and moisture control are mission-critical in lithium-ion manufacturing. Argon is used where a highly inert atmosphere is needed, and oxygen/hydrogen matter more in upstream materials, metals, and related chemical steps.
2. Supply mode pattern
The standard supply ladder is: packaged gases/cylinders → bulk liquid tanks → on-site generation / pipeline as plant size and continuity requirements rise. Linde explicitly describes supply modes ranging from cylinders to large cryogenic tanks and on-site systems; Airgas similarly frames the choice as cylinders, bulk, on-site, or pipeline based on plant scale and needs.
3. Best-fit supply mode by gigafactory stage
- Commissioning / early ramp: bulk liquid nitrogen with backup, plus packaged specialty gases.
- Mature 20–40+ GWh site: bulk plus strong case for on-site nitrogen generation.
- Very large multi-block site: economically strongest case for dedicated on-site / pipeline-style architecture with telemetry, redundancy, and long-term contracts.
4. Value proposition for industrial gas companies
For Linde, Air Liquide, Air Products, Messer, SIAD or regional players, the battery boom creates value in five ways:
(a) long-duration contracted volume, (b) high switching cost once the plant is qualified, (c) engineering and installation revenue, (d) digital monitoring / auto-replenishment services, and (e) expansion upside as factories add lines and adjacent materials plants. The suppliers themselves emphasize reliability, purity, customized systems, and automated replenishment as core benefits.
5. CEO takeaway
The best EV-battery gas opportunities in 2026 are not “all gigafactories.” They are the plants that combine large nameplate capacity, visible ramp-up, and long local OEM demand — especially Poland, Hungary, France, Nevada, Kansas, Ohio, and Georgia. Those are the sites where industrial gas suppliers can turn EV growth into stable recurring cash flow.