Learning to Communicate Ideas with Simple Drawings
Goal:
Enable leaders, entrepreneurs, and citizens to think visually — to clarify ideas fast, communicate clearly, and drive decisions through simple sketches.
🧭 Core Concept
“If you can draw it, you can explain it. If you can explain it simply, you can lead it.”
Sketch Thinking combines Stephen Few’s clarity, Dan Roam’s Show & Tell logic, and Mike Rohde’s hand-drawn storytelling.
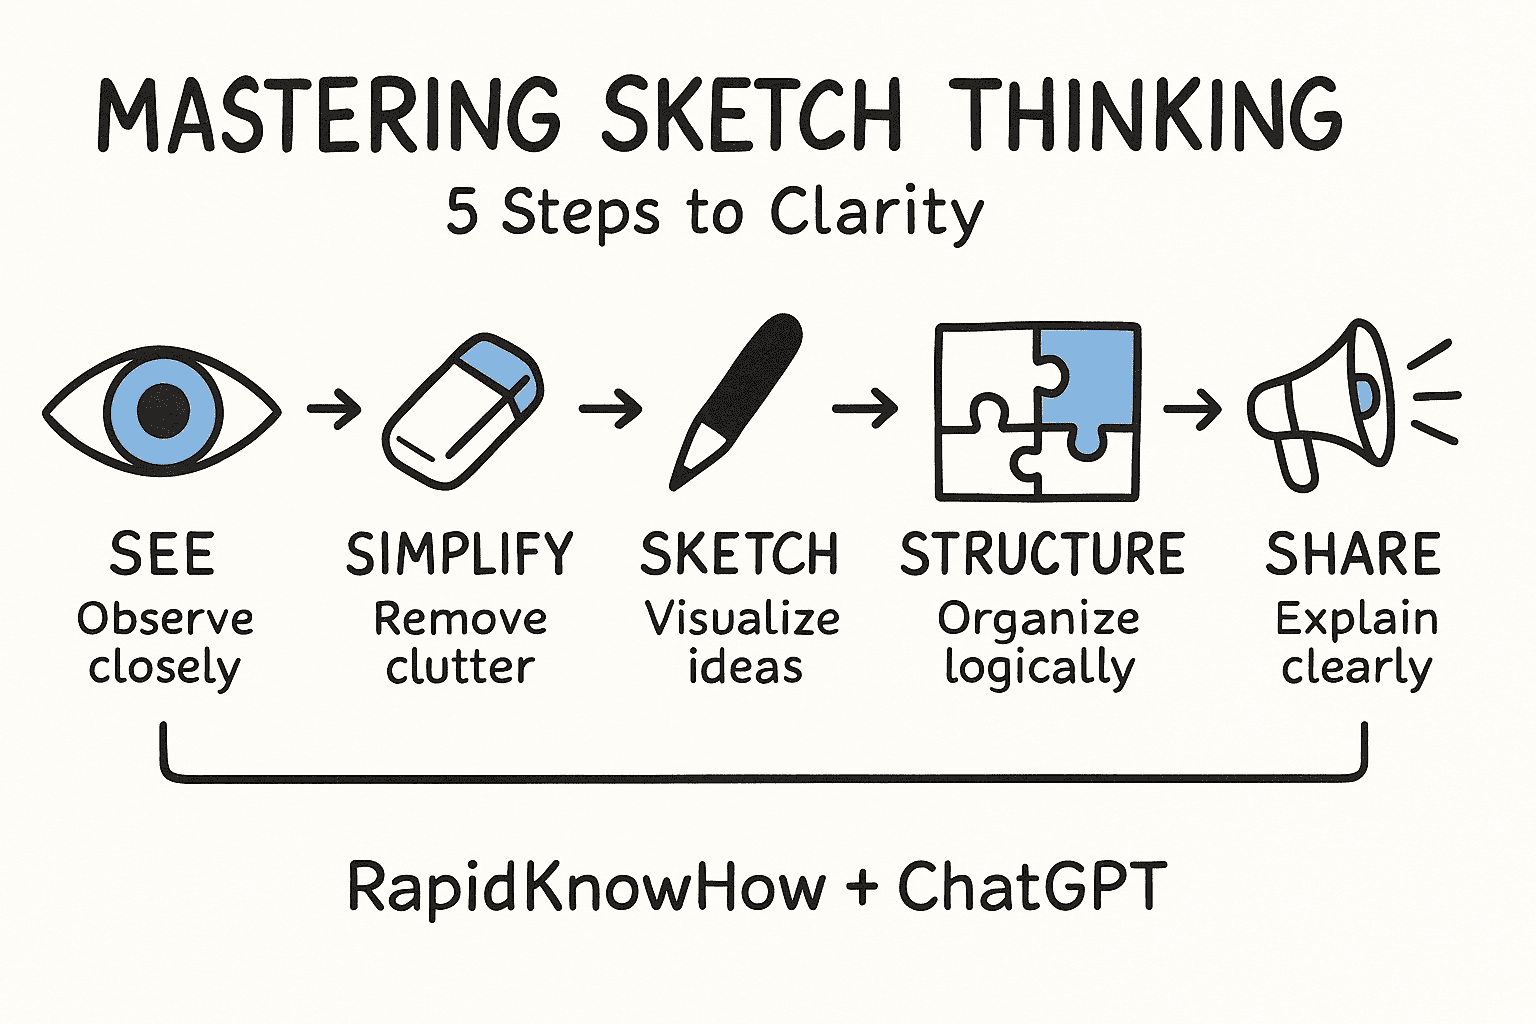
🧩 The 5-Step Framework
| Step | Action | Result |
|---|---|---|
| 1. See | Observe a situation or idea clearly. | Identify the essence of the message. |
| 2. Simplify | Reduce complexity to 3–5 elements. | Focus attention on what matters. |
| 3. Sketch | Use basic shapes: circles, arrows, lines, text. | Make thinking visible. |
| 4. Structure | Arrange visuals logically: flow, matrix, pyramid, or circle. | Transform chaos into meaning. |
| 5. Share | Present, teach, or publish. | Inspire action and understanding. |
✏️ Sketch Vocabulary
- Circles: Ideas, people, systems
- Arrows: Movement, cause & effect
- Squares: Processes, steps
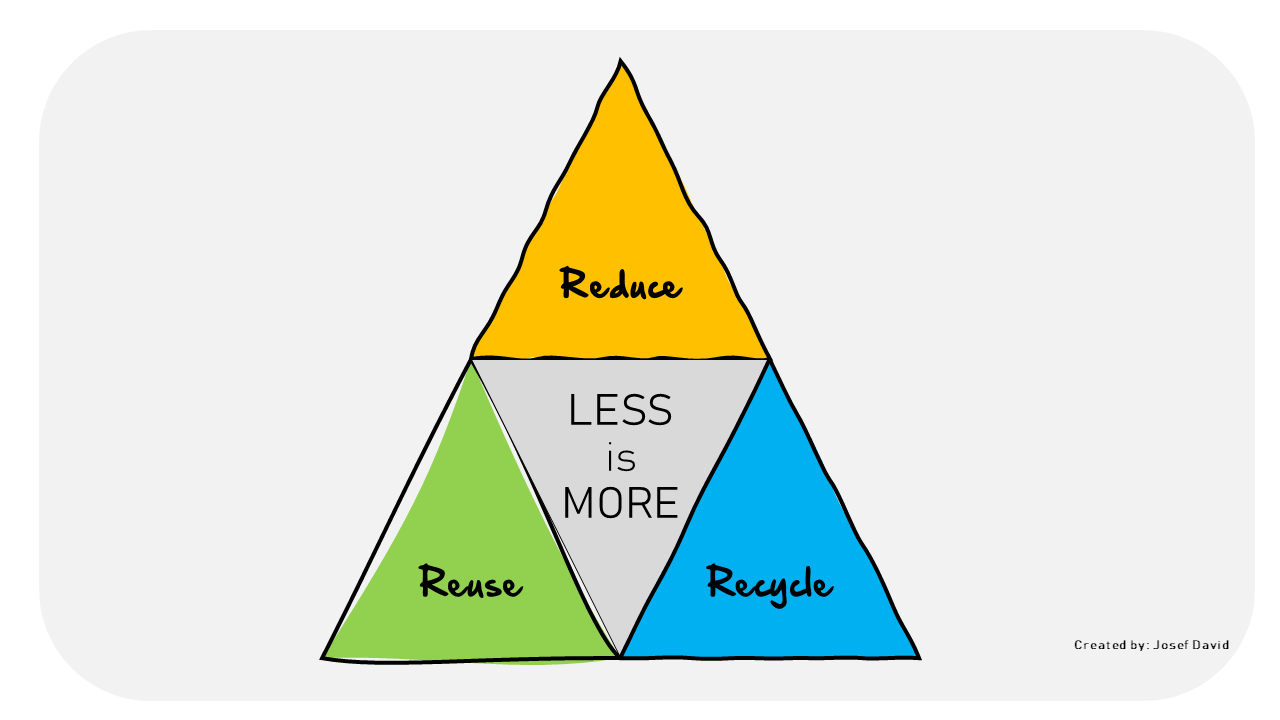
- Triangles: Hierarchies, priorities
- Icons: Lightbulb 💡 (idea), Handshake 🤝 (trust), Red dot 🔴 (action)
🌍 Applications
- Business: Strategy maps, ecosystem models, process clarity
- Politics: Power structures, stakeholder flow, decision maps
- Life: Goals, choices, priorities, and purpose diagrams
🔴 Master Sketch Exercise
Draw this in 30 seconds:
“The Path from Confusion to Clarity”
Start with:
💭 Cloud → ⚙️ Process Box → 💡 Lightbulb
Then label: “Idea → Action → Result.”
🧠 RapidKnowHow Signature Insight
“Sketch Thinking is not about art — it’s about clarity. The simpler the drawing, the stronger the message.” Josef David
Here are exact creative briefs of three business cases:
🎨 CASE 1 — From Process Chaos to Flow Map
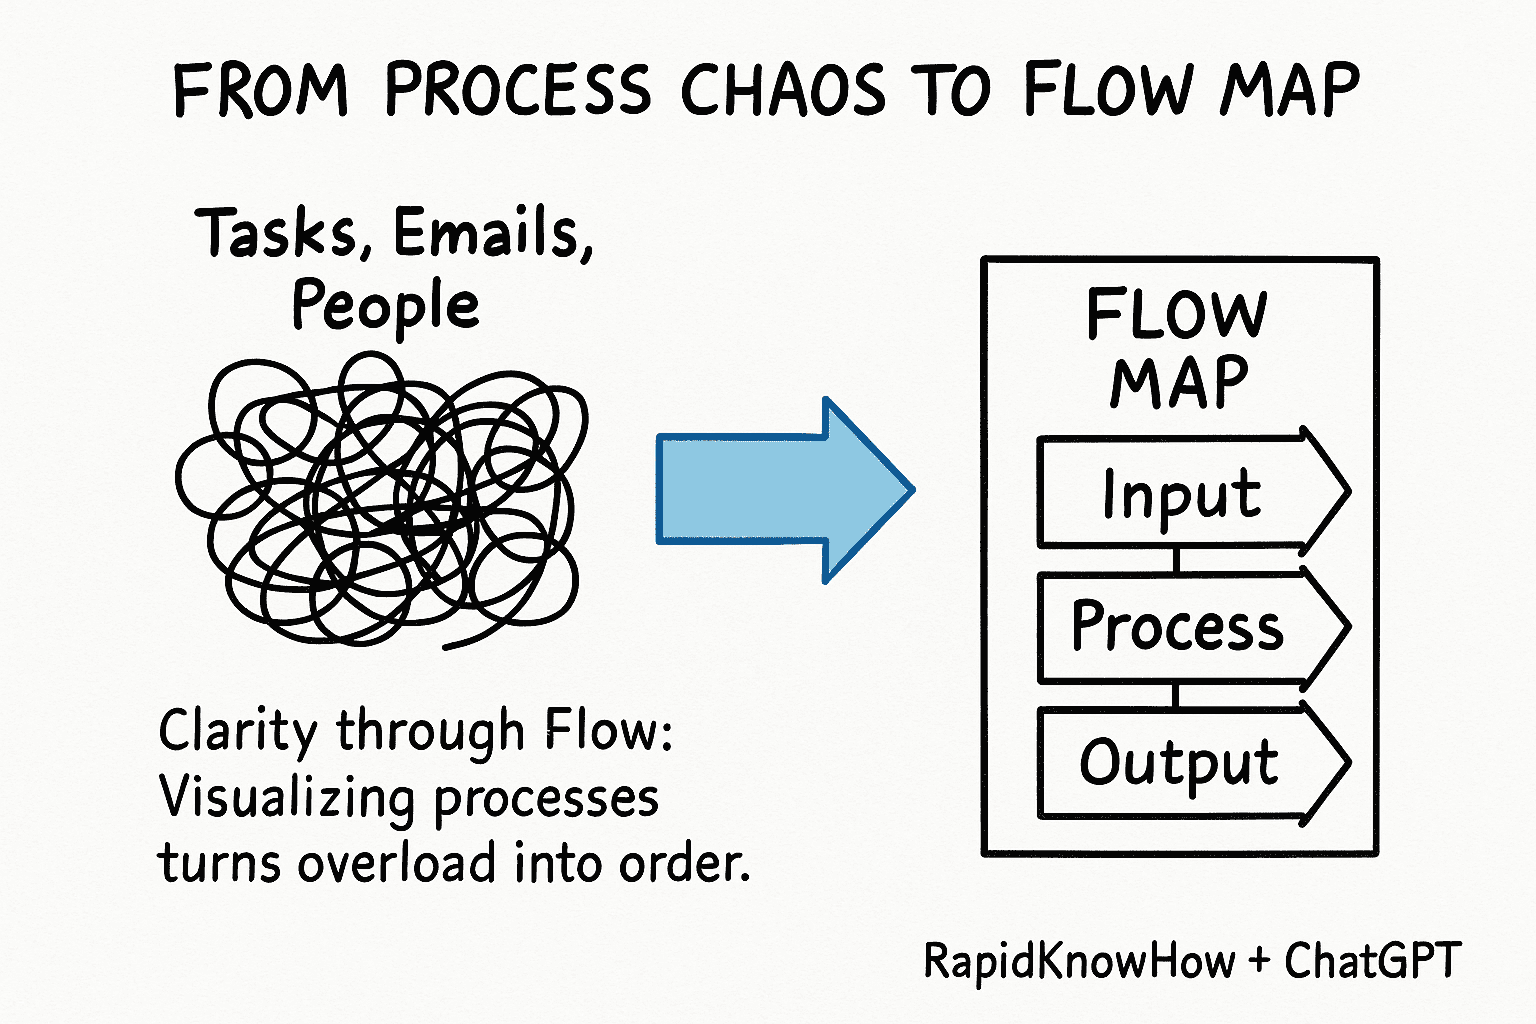
Goal: Show how leaders can turn messy workflows into visual clarity.
Sketch Elements:
- Left: chaotic scribbles labeled “Tasks, Emails, People”
- Arrow to right →
- Right: neat horizontal Flow Map (Boxes + arrows: Input → Process → Output)
- Caption:
“Clarity through Flow: Visualizing processes turns overload into order.”
🎨 CASE 2 — The Client Journey Map
Goal: Replace complex CRM reports with one simple customer path sketch.
Sketch Elements:
- Line with 5 points labeled: Awareness → Consideration → Purchase → Use → Loyalty
- Above each point: tiny icons (eye 👁, magnifier 🔍, cart 🛒, gear ⚙️, heart ❤️)
- Blue path line across; red dot at “Loyalty.”
- Caption:
“Seeing through your client’s eyes reveals the real business value.”
🎨 CASE 3 — AI-Driven Value Chain
Goal: Illustrate how AI connects decision points across the value chain.
Sketch Elements:
- Horizontal chain: R&D → Production → Sales → Service
- AI brain icon 🧠 above, with dashed lines linking to each step.
- Red dot pulse around AI node.
- Caption:
“AI turns data into insight — insight into sustainable action.”