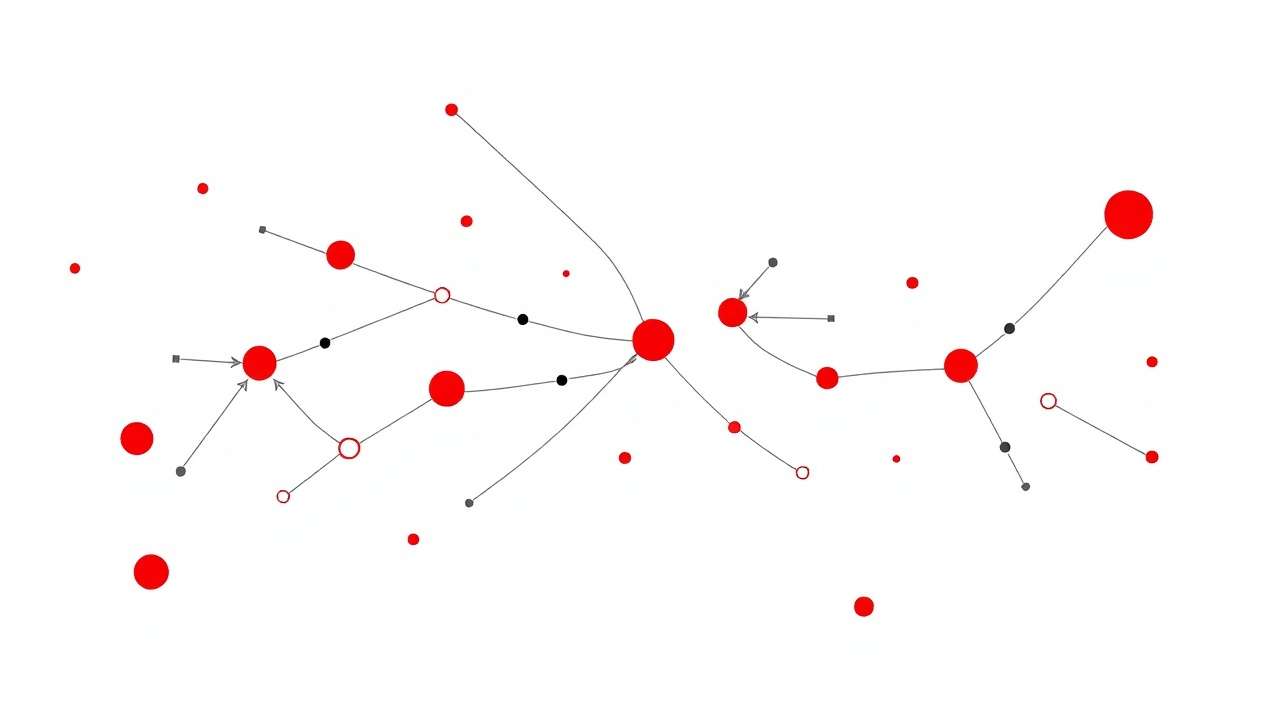
Public Transparency Dashboards Active > Audit Power Structures > Expose Inefficiencies > Open Data
“Democracy survives when citizens can see what power does in real time.”
— RapidKnowHow + ChatGPT
🔍 STRATEGIC INSIGHT — THE NEW DEMOCRATIC OPERATING SYSTEM
Between 2025 and 2030, political legitimacy will depend on transparency in action, not promises in speeches.
Governments that keep data closed breed mistrust and corruption.
Governments that open their data and processes to citizens build a self-correcting ecosystem of trust.
This is the core shift of Politics-as-a-Service (PaaS):
Politics no longer as a power hierarchy, but as a transparent information network connecting citizens, institutions, and AI-driven verification systems.
Transparency Index = (Truth × Timeliness × Accessibility) ÷ Bureaucracy
🧩 STEP 1 — AUDIT POWER STRUCTURES
Goal: Make power visible — who holds it, how it flows, and where it stalls.
| Dimension | Audit Question | Indicator (0–100) |
|---|---|---|
| 1️⃣ Decision Visibility | Can citizens trace how key decisions are made? | Transparency Score |
| 2️⃣ Resource Allocation | Is budget spending open, verifiable, and traceable? | Fiscal Openness Index |
| 3️⃣ Lobbying Influence | Are lobby groups, donations, and political ties disclosed? | Integrity Ratio |
| 4️⃣ Bureaucratic Efficiency | How much time and money is lost in redundant processes? | Efficiency Score |
| 5️⃣ Citizen Feedback Loop | Can citizens challenge, comment, or co-decide on policies? | Participation Index |
| 6️⃣ AI-Governance Integration | Are AI systems used for fairness or control? | Ethical Tech Index |
Audit Output: A Power Map showing who controls what, how efficiently they act, and how transparent they are.
Deliverable:
🔹 Power Transparency Dashboard 1.0 — a dynamic visual showing real-time decision and spending flows.
🔹 Public Audit Summary — published online with data and narrative clarity.
⚙️ STEP 2 — EXPOSE INEFFICIENCIES
Once power is mapped, the next move is to expose inefficiencies — not to blame, but to optimize governance.
| Inefficiency Type | Typical Symptom | Corrective Action |
|---|---|---|
| Bureaucratic Overlap | Duplicated agencies, conflicting mandates | Merge or automate via AI |
| Information Asymmetry | Data hidden within ministries | Open data policy, citizen API access |
| Financial Leakage | Budget opacity, procurement bias | Smart contracts and audit bots |
| Regulatory Drag | Policy approval bottlenecks | Fast-track innovation zones |
| Political Patronage | Appointments via loyalty not merit | Transparent qualification dashboards |
| Communication Noise | Unverified claims, state-controlled narratives | Fact-checking alliances and media audits |
Exposing inefficiency is the new form of public accountability —
it turns complexity into clarity and confusion into trust.
🧠 STEP 3 — OPEN DATA AS THE TRUST ENGINE
Open Data transforms governance from a closed black box into a public value creation platform.
| Open Data Domain | Key Information Released | Expected Impact |
|---|---|---|
| Public Finance | Real-time state budgets, procurement contracts | Eliminates corruption leaks |
| Policy Tracking | Legislative timelines, voting records | Increases policy accountability |
| Infrastructure Projects | Cost, contractors, timelines | Reduces waste, builds confidence |
| Health & Education Data | Public outcomes dashboards | Measures real citizen impact |
| AI & Algorithm Use | Transparency of AI in administration | Prevents bias, enhances fairness |
| Political Donations | Full disclosure of funding sources | Restores democratic integrity |
The outcome: Data Citizenship — a new right where citizens are not only voters, but verifiers.
🧭 STEP 4 — ACTIVATE PUBLIC TRANSPARENCY DASHBOARDS
The Transparency Dashboard is your ecosystem’s single source of verified truth.
| Dashboard Layer | Function | User Benefit |
|---|---|---|
| 1️⃣ Power Flow Map | Visualizes decision-makers, links, and influence | Understand who drives policy |
| 2️⃣ Budget Tracker | Live expenditure and project delivery metrics | Exposes inefficiency in real time |
| 3️⃣ Law & Policy Monitor | Tracks policy promises vs outcomes | Connects rhetoric with reality |
| 4️⃣ Citizen Participation Board | Lets users comment, rate, and propose | Creates active democratic dialogue |
| 5️⃣ Integrity Heatmap | Flags potential corruption or data gaps | Encourages ethical compliance |
Transparency Dashboards shift democracy from spectator mode → collaborative intelligence.
💡 RAPIDKNOWHOW FORMULA
Democratic Efficiency = (Transparency × Participation × Accountability) ÷ Corruption
- Transparency rebuilds trust.
- Participation empowers citizens as co-owners of governance.
- Accountability maintains systemic integrity.
- Corruption, when reduced, exponentially increases system value.
🧬 STEP 5 — BUILD YOUR POLITICS ECOSYSTEM BLUEPRINT
| Component | Action | Outcome 2030 |
|---|---|---|
| Vision | “From Party Power to Citizen Transparency” | Shared purpose of clean governance |
| Governance Model | Multi-level, data-driven collaboration | AI-verified decision transparency |
| Data Infrastructure | Open API across all ministries | Real-time data integration |
| Citizen Interface | Transparent dashboards accessible to all | Participatory democracy |
| Audit Cadence | Annual Transparency Index publication | Global benchmarking & accountability |
The Transparency Blueprint makes trust measurable —
a living, updating indicator of democratic health.
🚀 CONCLUSION
“In the future, political power will not be owned — it will be audited.”
To master Politics Ecosystem Leadership 2025–2030:
1️⃣ Audit where power resides and how it operates.
2️⃣ Expose inefficiencies with open, verifiable data.
3️⃣ Activate real-time public dashboards.
4️⃣ Measure progress with the Transparency Index.
The result:
A Transparent Democracy Ecosystem — where data replaces propaganda, and citizens become co-leaders of governance.


