
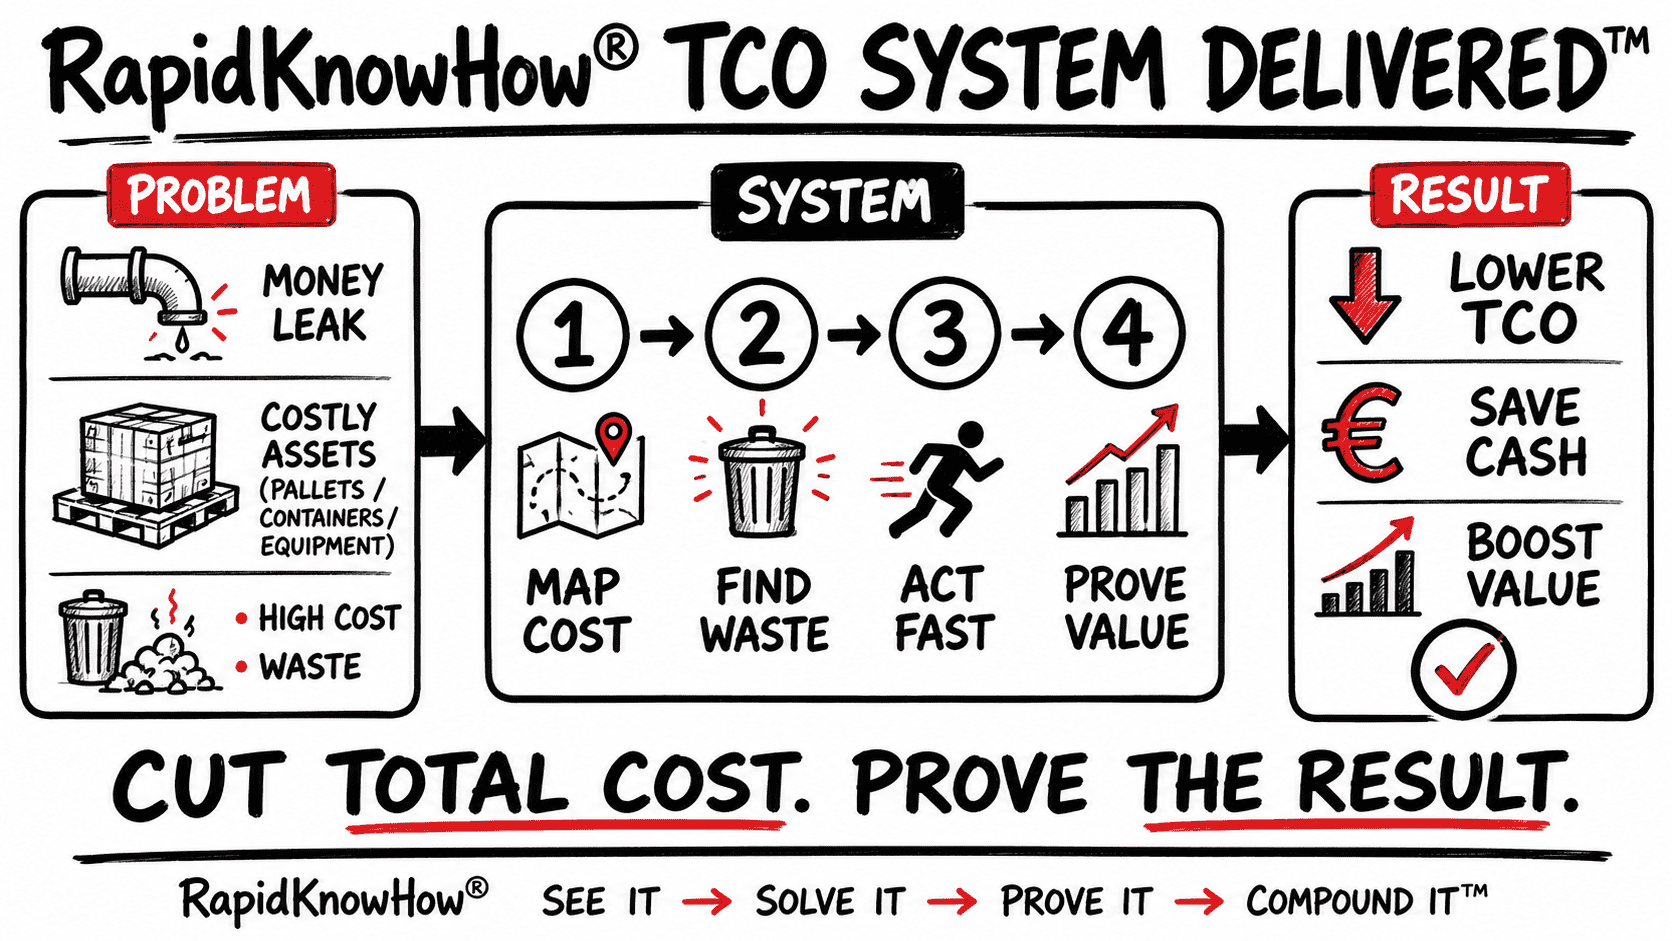
BUSINESS CASE — POWER REPORT
Strategic Objective: Turn industrial gas supply from a price negotiation into a measurable customer-value system.
Core Proposition:
Do not compete on €/Nm³ alone. Reduce the customer’s total annual cost of gas supply and use — prove the cash impact — share the value — scale the result.
1. THE BUSINESS PROBLEM
Industrial gas purchasing is often managed around:
Gas price → €/Nm³ → annual contract negotiation
This view misses a large part of the economic reality.
The customer also pays for:
- Delivery and emergency delivery
- Storage and tank utilization
- Energy and pressure requirements
- Cylinder and bulk handling
- Ordering and administration
- Excess inventory
- Venting and boil-off
- Overconsumption
- Stockouts
- Production interruptions
- Safety and operational risk
The consequence
A supplier can appear 5% more expensive on gas price while still delivering the lowest total cost to the customer.
The strategic opportunity is therefore:
MOVE FROM PRICE TO TCO
2. THE RAPIDKNOWHOW® SOLUTION
Industrial Gas TCO System™
A repeatable 10-step customer-value system:
1 — SEE THE FULL COST
Measure more than €/Nm³.
2 — MAP THE COST DRIVERS
Locate where industrial gas cost is created and lost.
3 — MEASURE THE BASELINE
Calculate the customer’s current annual TCO.
4 — FIND THE HIDDEN COST
Expose losses the customer often does not measure.
5 — TARGET THE BIGGEST LOSS
Attack the highest-value cost leak first.
6 — DESIGN THE BETTER SYSTEM
Redesign supply, replenishment, inventory, service and usage.
7 — PROVE THE SAVING
Demonstrate before-versus-after results.
8 — SHARE THE VALUE
Create measurable value for customer and supplier.
9 — LOCK IN THE RESULT
Protect the improvement with KPIs and operating routines.
10 — COMPOUND THE VALUE
Replicate across gases, plants, customers and countries.
3. THE TCO ECONOMIC MODEL
Industrial Gas TCO
TCO =
Gas Purchase
+ Logistics
+ Storage
+ Energy
+ Handling
+ Administration
+ Losses
+ Downtime
+ Risk
The commercial question changes from:
“What price can you give me?”
to:
“How much annual cash can we remove from the complete gas system?”
That is the fundamental strategic shift.
4. BUSINESS CASE — CUSTOMER EXAMPLE
Assume a manufacturing site with significant bulk industrial gas consumption.
Current annual TCO
| Cost Driver | Annual Cost |
|---|---|
| Gas purchase | €1,200,000 |
| Logistics | €180,000 |
| Storage | €90,000 |
| Energy | €220,000 |
| Administration | €40,000 |
| Gas losses | €70,000 |
| Downtime / operational risk | €200,000 |
| TOTAL TCO | €2,000,000 |
The purchasing department may concentrate primarily on the €1.2 million gas bill.
RapidKnowHow® analyzes the entire €2.0 million system.
5. IDENTIFY THE VALUE LEAK
The analysis reveals five economically relevant losses:
1. Excess delivery frequency
Poor planning creates unnecessary transport cost.
2. Excess inventory
Safety stock is higher than required.
3. Emergency deliveries
Manual ordering creates avoidable premium logistics.
4. Gas losses
Venting, boil-off and inefficient consumption increase cost.
5. Production interruption exposure
Stockout risk creates potentially very high consequential cost.
The largest opportunity is selected first.
ONE PRIORITY
Stabilize replenishment while reducing inventory and emergency deliveries.
6. THE BETTER INDUSTRIAL GAS SYSTEM
RapidKnowHow® redesigns the operating model around:
Tank telemetry
↓
Consumption visibility
↓
Predictive demand
↓
Automatic replenishment
↓
Optimized delivery planning
↓
Lower safety stock
↓
Lower stockout risk
↓
Lower annual TCO
The objective is not simply to optimize a delivery.
The objective is to improve the complete customer gas system.
7. VERIFIED ECONOMIC VALUE
Example improvement after implementation:
| Improvement | Annual Value |
|---|---|
| Logistics reduction | €60,000 |
| Inventory / capital reduction | €25,000 |
| Lower gas losses | €20,000 |
| Administration reduction | €15,000 |
| Reduced downtime / risk | €100,000 |
| TOTAL ANNUAL VALUE | €220,000 |
Result
Baseline TCO: €2.000m
Improved TCO: €1.780m
Annual customer value created: €220,000
TCO reduction: 11%
8. WHY THIS CHANGES THE SALES GAME
Consider two suppliers.
Supplier A
Gas price:
€1.00/Nm³
Little optimization support.
Supplier B
Gas price:
€1.03/Nm³
But delivers:
- Lower logistics cost
- Lower inventory
- Automatic replenishment
- Fewer emergency deliveries
- Lower losses
- Higher supply reliability
- Reduced downtime exposure
Supplier B may charge the higher unit price while delivering the lower total annual cost.
Therefore:
LOWEST PRICE ≠ LOWEST COST
And:
LOWEST VERIFIED TCO CAN JUSTIFY A PREMIUM PRICE
9. VALUE SHARING MODEL
Assume verified customer savings of:
€220,000 PER YEAR
A possible commercial architecture could be:
Customer retains: €165,000
Supplier captures: €55,000
The customer still receives:
€165,000 recurring annual benefit
while the supplier earns additional recurring value for making the system work.
This changes the commercial relationship from:
Seller ↔ Buyer
to:
VALUE CREATION PARTNERS
10. CUSTOMER VALUE
The customer receives five strategic benefits:
LOWER CASH COST
Lower annual operating expenditure.
LOWER WORKING CAPITAL
Reduced safety stock and inventory.
HIGHER RELIABILITY
Fewer emergency deliveries and stockouts.
LOWER RISK
Reduced exposure to production interruption.
LOWER MANAGEMENT EFFORT
More automation and fewer manual interventions.
The customer buys more than molecules.
The customer buys:
RELIABLE GAS AT THE LOWEST SUSTAINABLE TOTAL COST
11. SUPPLIER VALUE
The industrial gas supplier gains something equally important.
1. Less price pressure
The discussion moves beyond €/Nm³.
2. Stronger differentiation
Competitors must challenge an integrated value system rather than simply offer a lower price.
3. Higher customer retention
A proven operating system becomes deeply embedded in the customer process.
4. Recurring value revenue
The supplier can monetize monitoring, optimization and service.
5. Multi-site expansion
One proven case can be replicated.
6. Cross-gas expansion
O₂ → N₂ → Ar → CO₂ → specialty gases.
7. Better Free Cash Flow
Recurring value creation can translate into recurring margin and cash generation.
12. THE COMPOUNDING MODEL
The real economic power appears after the first successful case.
ONE SITE
€220k annual TCO improvement
↓
5 SITES
Potential value pool:
€1.1m/year
↓
20 SITES
Potential value pool:
€4.4m/year
↓
MULTIPLE GASES
Additional opportunities emerge.
↓
MULTIPLE CUSTOMERS
The methodology becomes repeatable.
↓
SYSTEM LICENCE
The know-how itself becomes a scalable commercial asset.
13. RAPIDKNOWHOW® COMMERCIAL VALUE
The valuable asset is not a single consulting analysis.
It is the repeatable system:
Diagnose → Quantify → Improve → Prove → Preserve → Replicate
RapidKnowHow® can package this as:
Industrial Gas TCO Assessment™
Identify the complete customer TCO and value opportunity.
Industrial Gas TCO Action Guide™
Define the highest-value improvement.
Industrial Gas TCO Delivered™
Implement and prove the result.
Industrial Gas TCO Operating System™
Maintain the KPI system and improvement cycle.
Industrial Gas TCO Licence™
Transfer the repeatable methodology to industrial gas companies, distributors or major users.
14. KPIs THAT PROVE THE SYSTEM
The system should continuously track a small number of business KPIs:
TCO € / year
TCO € / Nm³
OTIF %
Stockouts
Emergency deliveries
Average tank level
Inventory days
Gas losses %
Specific gas consumption
Energy per Nm³
Production downtime
Verified annual savings
These numbers convert the value claim into evidence.
15. THE BOARD-LEVEL BUSINESS CASE
The proposition can be summarized in one line:
REDUCE CUSTOMER TCO → CAPTURE PART OF THE VALUE → PROTECT THE RESULT → SCALE THE SYSTEM
This creates three simultaneous outcomes.
CUSTOMER
Lower cost + lower risk + higher reliability.
INDUSTRIAL GAS SUPPLIER
Higher differentiation + stronger retention + recurring cash generation.
RAPIDKNOWHOW®
Reusable IP + licence potential + repeatable value system.
FINAL STRATEGIC ASSESSMENT
The RapidKnowHow® Industrial Gas TCO System™ is commercially powerful because it attacks one of the structural weaknesses of traditional industrial gas selling:
PRICE IS EASY TO COMPARE. VALUE IS HARDER TO REPLACE.
A supplier competing primarily on gas price exposes itself to continual price pressure.
A supplier that can measure, reduce and prove the customer’s total annual cost changes the basis of competition.
The winning sequence is:
SEE THE COST
FIND THE LOSS
FIX THE SYSTEM
PROVE THE CASH
SHARE THE VALUE
LOCK IN THE RESULT
COMPOUND THE VALUE
POWER CONCLUSION
Do not sell industrial gas cheaper.
Build and prove the industrial gas system that makes the customer economically better off.
That is the core business case for:
RapidKnowHow® INDUSTRIAL GAS TCO SYSTEM DELIVERED™
Lower Customer TCO → Higher Supplier Value → Recurring FCF → Compounding Business Value
Calculate the Industrial Gas TCO Business Case
| Cost Driver | Current € | Improved € |
|---|---|---|
| Gas Purchase | ||
| Logistics | ||
| Storage / Inventory | ||
| Energy | ||
| Handling | ||
| Administration | ||
| Gas Losses | ||
| Downtime | ||
| Risk |
RapidKnowHow® — THE DECISION COMPANY™
Industrial Gas Leadership 2030
PROVE VALUE. THEN SCALE.
Watch the 60-second roadmap: 10 strategic actions for DACH and CEE, 2026–2030.
Start with ONE customer challenge. Use the Industrial Gas Action Guide to turn your first action into a measurable result.
RapidKnowHow® — Leading Industrial Gas Opportunity Signal Identifier in DACH & CEE