

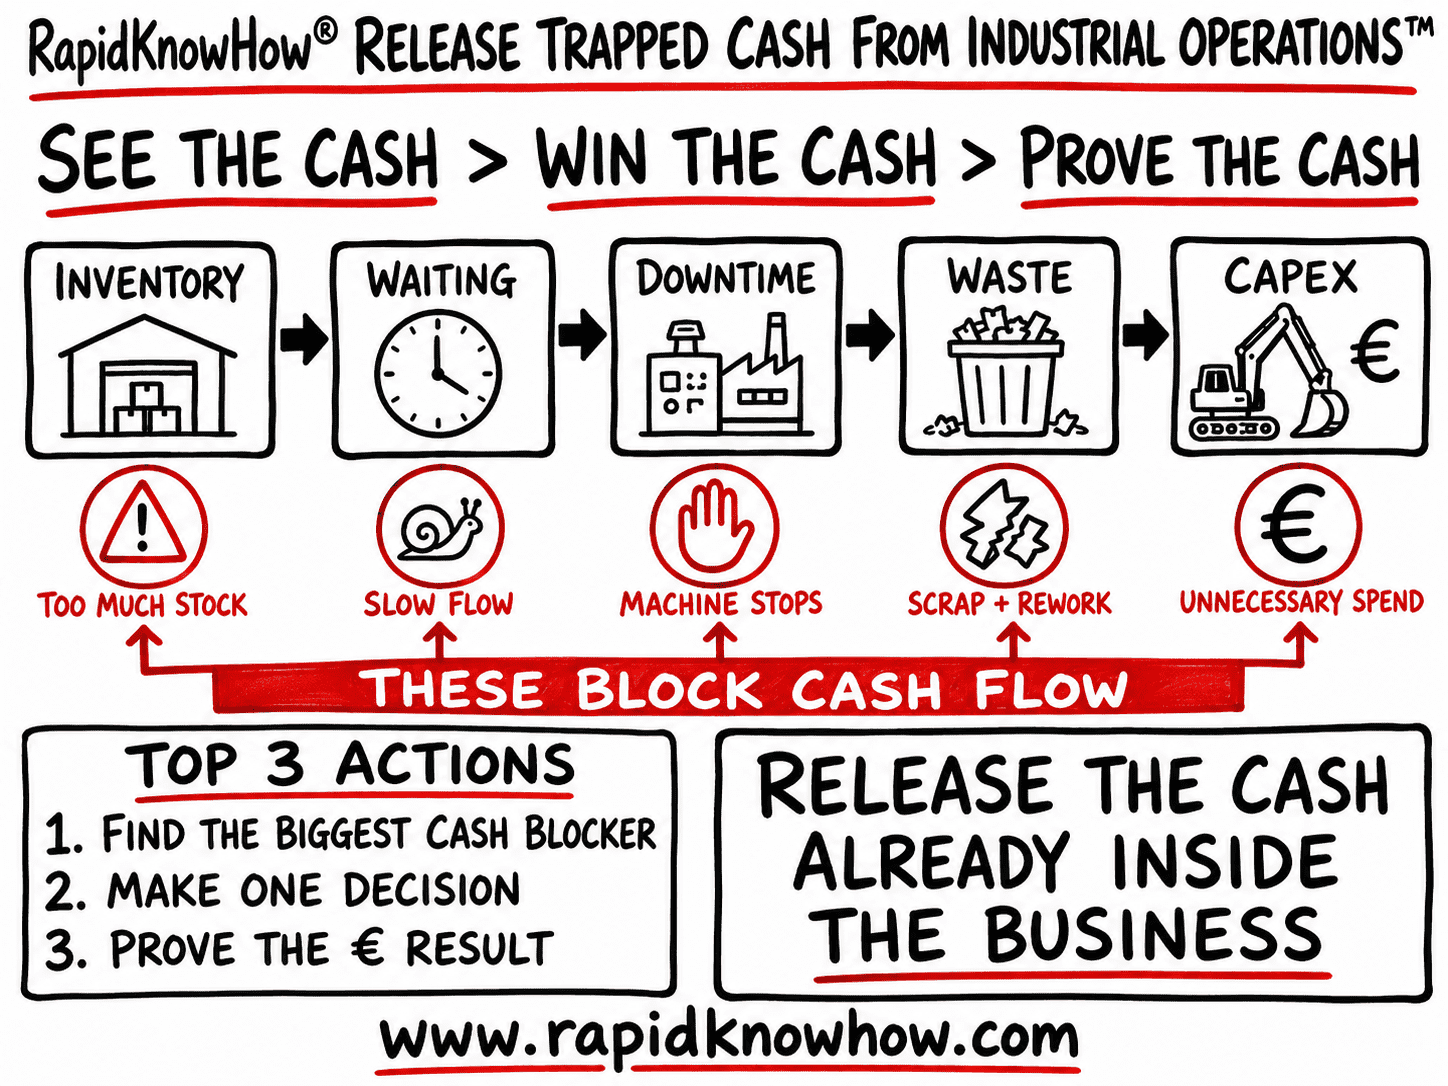
RELEASE TRAPPED CASH FROM INDUSTRIAL OPERATIONS
SEE THE CASH → WIN THE CASH → PROVE THE CASH™
Board Conclusion
Most industrial companies do not first need more sales, more machines, or more capital. They need to release the cash already trapped inside operations.
The target is simple:
INVENTORY ↓ + WAITING ↓ + DOWNTIME ↓ + WASTE ↓ + CAPEX ↓ → FCF ↑
1. SIGNAL — SEE THE CASH™
Cash is commonly trapped in:
Raw Materials
Work in Progress
Finished Goods
Slow Production Flow
Low Asset Utilization
Unplanned Downtime
Scrap + Rework
Emergency Logistics
Excess Safety Stock
Unnecessary Capex
The Board Question
HOW MUCH CASH COULD WE RELEASE WITHOUT REDUCING CUSTOMER SERVICE OR OPERATING RELIABILITY?
2. PROBLEM
The business may report acceptable revenue and EBIT while cash remains trapped inside the operating system.
Typical pattern:
Forecast uncertainty
→ more safety stock
→ more working capital
→ more storage
→ more handling
→ more complexity
→ slower flow
→ more capital
→ lower FCF
The problem is therefore not:
“Inventory is too high.”
It is:
THE OPERATING SYSTEM REQUIRES TOO MUCH CASH TO PRODUCE EACH €1 OF CUSTOMER VALUE.
3. ONE DECISION
RELEASE TRAPPED OPERATING CASH BEFORE ADDING NEW CAPITAL.
Management commits to one quantified target:
RELEASE €X CASH IN 90–120 DAYS WITHOUT HARMING OTIF, QUALITY OR SAFETY.
4. TOP 3 ACTIONS — WIN THE CASH™
ACTION 1 — FIND THE BIGGEST CASH BLOCKERS
Map cash through the complete operating flow:
Supplier
→ Raw Material
→ Production
→ WIP
→ Finished Product
→ Warehouse
→ Customer
Measure:
- Inventory days
- WIP
- Cycle time
- Waiting time
- Bottleneck capacity
- Downtime
- Scrap
- Emergency shipments
- Asset utilization
Output
TOP 3 CASH BLOCKERS IN €
Not 50 improvement projects.
ACTION 2 — REMOVE THE ROOT CAUSE
Examples:
Excess Inventory
Poor replenishment
→ better demand signal
→ smaller buffers
→ cash released
WIP
Production imbalance
→ remove bottleneck
→ faster flow
→ less WIP
Downtime
Reactive maintenance
→ preventive / predictive action
→ uptime ↑
Low Asset Utilization
Poor scheduling
→ better use of existing equipment
→ avoid new capex
Scrap
Quality problem
→ root-cause correction
→ material + labor + energy saved
ACTION 3 — LOCK THE CASH INTO THE OPERATING SYSTEM
Once cash has been released:
Standardize the new process.
Otherwise inventory and cost return.
Build:
Operating Rule
→ KPI
→ Owner
→ Trigger
→ Weekly Review
→ Corrective Action
The result must become the new operating standard.
5. ILLUSTRATIVE BUSINESS CASE
Example Industrial Company
Annual Revenue: €300 million
Annual Operating Cost: €240 million
Inventory: €60 million
Annual Capex: €20 million
These numbers are illustrative, not verified client data.
Cash Opportunities Identified
| Cash Lever | Current | Improvement Scenario | Potential Value |
|---|---|---|---|
| Inventory | €60.0m | −10% | €6.0m cash release |
| Scrap + Rework | €8.0m/year | −15% | €1.2m/year |
| Emergency Logistics | €3.0m/year | −25% | €0.75m/year |
| Downtime Loss | €6.0m/year | −10% | €0.60m/year |
| Planned Capex | €20.0m | 10% avoided/deferred | €2.0m cash protected |
Illustrative First-Year Value
€10.55 MILLION
Comprising:
€6.0m working-capital release
- €2.55m operating improvement
- €2.0m capex avoided/deferred
6. PROVE THE CASH™
Every claim must pass this test:
BASELINE → ACTION → RESULT → € CASH
Example:
BEFORE
Inventory:
€60m
ACTION
Replenishment rules changed.
Safety stocks reset.
Bottleneck flow improved.
AFTER
Inventory:
€54m
Customer service:
Maintained or improved
VERIFIED RESULT
€6m CASH RELEASED
That is proof.
7. RapidKnowHow® INDUSTRIAL CASH SCOREBOARD™
| KPI | Direction |
|---|---|
| Inventory Days | ↓ |
| WIP | ↓ |
| Cycle Time | ↓ |
| Downtime | ↓ |
| Scrap / Rework | ↓ |
| Emergency Freight | ↓ |
| Asset Utilization | ↑ |
| OTIF | Maintain / ↑ |
| Capex Requirement | ↓ |
| FCF | ↑ |
| ROCE | ↑ |
8. 90-DAY EXECUTION MODEL
DAYS 1–15 — SEE
Map Cash
→ Establish Baseline
→ Identify Top 3 Cash Blockers
DAYS 16–45 — WIN
Make ONE Decision
→ Execute Top 3 Actions
→ Remove Root Causes
DAYS 46–90 — PROVE
Verify Cash Release
→ Confirm Service + Quality
→ Standardize New System
DAY 90+
REPEAT ACROSS PLANTS, PRODUCTS AND REGIONS
9. RapidKnowHow® GIVE + GET™
A fair commercial model links RapidKnowHow® value received to client value created.
CLIENT GETS
Illustrative:
€10.55m first-year economic value
CLIENT GIVES
Illustrative RapidKnowHow® engagement:
€250,000
Client Value Multiple
€10.55m ÷ €0.25m = 42.2×
This is an illustration, not a proposed or agreed fee.
Example Payment Structure
30% UPFRONT
Access, preparation, baseline, cash map.
40% PERFORMANCE
Triggered when first agreed cash/KPI impact is verified.
30% SUCCESS
Triggered when sustained value and handover are verified.
GIVE VALUE → GET VALUE → GROW VALUE™
10. THE COMPOUNDING EFFECT
The first €10m is not the final prize.
The real prize is the system.
ONE Plant
→ € Cash Released
→ Proven Method
→ Standard Process
→ Second Plant
→ Third Plant
→ Group Standard
→ Recurring FCF
Example:
If one proven method produces even €2m repeatable value per plant across 10 plants:
€20 MILLION SYSTEM VALUE
The economics come from repetition.
RapidKnowHow® INDUSTRIAL OPERATIONS CASH ENGINE™
SEE THE CASH
Find:
Inventory + WIP + Waste + Downtime + Idle Assets + Capex
↓
WIN THE CASH
ONE Decision
→ TOP 3 Actions
→ Remove Root Causes
↓
PROVE THE CASH
Working Capital ↓
Operating Cost ↓
Capex ↓
FCF ↑
ROCE ↑
↓
OWN THE SYSTEM
Standardize what worked.
↓
COMPOUND THE CASH
ONE OPERATING WIN → MANY PLANTS → RECURRING FCF
THE STRATEGIC CHOKEPOINT
The biggest mistake is:
TRYING TO GENERATE MORE CASH WHILE CONTINUING TO OPERATE A SYSTEM THAT TRAPS CASH.
The RapidKnowHow® alternative:
RELEASE THE CASH ALREADY INSIDE THE BUSINESS FIRST.
MASTER FORMULA
**SEE THE TRAPPED CASH
→ FIND THE BIGGEST BLOCKER
→ MAKE ONE DECISION
→ TAKE TOP 3 ACTIONS
→ PROVE THE € RESULT
→ STANDARDIZE
→ REPEAT
→ COMPOUND FCF™**
RapidKnowHow® POWER BUSINESS CASE
DON’T ASK FIRST: “HOW DO WE GROW?”
ASK: “HOW MUCH CASH CAN WE RELEASE FROM WHAT WE ALREADY OWN?”
Leave a Reply