
RAPIDKNOWHOW® · YOUR NEXT COMMERCIAL STEP
START SMALL. PROVE VALUE. SCALE WHAT WORKS.
1 — START: Get the matching PowerProduct
RapidKnowHow® Industrial Gas AI Orchestrator — Action Guide — €299
Review the contents and current checkout total before buying. This is a self-guided PDF; implementation support and licensing are separate.
Confirmed payment → PDF download access + order email. Bank transfer requires payment confirmation.
2 — PROVE: Build your real cash case
Select one industrial gas customer, asset or supply flow and verify its net cash improvement over 30–90 days. Scope, fees, baseline and verification criteria are agreed before any mandate begins.
REQUEST MY VALUE-PROOF FIT CHECK →
Start your message: TCO CASH CASE · your business problem · desired 30–90 day result. Avoid confidential information.
3 — SCALE: Repeat through an annual licence
After verified value, explore repeat use across teams, sites or partners. Rights, support, fees and renewal terms require a written agreement.
Choose the route that fits your need. An enquiry creates no payment commitment. Business outcomes depend on implementation and evidence.
PowerReport 2026–2030
AI-Orchestrated Industrial Gas Growth Without Buying Growth First
Status: September 2026
ONE CONCLUSION
DO NOT CHASE GAS VOLUME.
CONTROL THE CUSTOMER GAS FLOW — AND COMPOUND THE CASH.
The strongest DACH + CEE industrial-gas model for 2026–2030 is not:
MORE PLANTS → MORE CAPEX → MORE TONNES → HOPE FOR RETURNS.
It is:
CUSTOMER PROBLEM → TCO VALUE → RECURRING GAS FLOW → VERIFIED FCF → SELECTIVE REINVESTMENT → MORE FCF.
The current European evidence supports this direction. In Q2 2026 Linde’s EMEA underlying sales rose only 1%; pricing contributed +2% while volumes remained lower, particularly in manufacturing. Yet EMEA operating margin remained about 35.7%. (Linde) Air Liquide likewise reported H1 2026 growth accompanied by nearly €300 million of efficiencies, a 110-basis-point operating-margin improvement excluding stated effects, and operating cash flow before working-capital changes up 8% excluding currency. (Air Liquide)
Strategic implication: Europe in 2026 rewards pricing discipline + productivity + customer lock-in + capital discipline, not indiscriminate volume growth.
1. THE SFCF INDUSTRIAL GAS MODEL
SFCF = SELF-FINANCED FREE CASH FLOW
The system starts with one binding rule:
Every growth move should either create cash, protect cash or have a clearly verifiable path to future recurring FCF.
The industrial-gas SFCF equation is:
Existing Customer Cash Flow
- Price/Mix Improvement
- Productivity
- Working-Capital Release
- Asset Utilization
- New Share-of-Wallet
- New Recurring Contracts
- Customer-Funded / Contract-Backed Investment
− Maintenance Capital
− Selective Growth Capital
=
SELF-FINANCED FCF
That FCF finances the next highest-return move.
2. WHY INDUSTRIAL GAS IS IDEAL FOR SFCF
Industrial gases possess characteristics unusually well suited to a self-financing model:
| Structural Feature | SFCF Effect |
|---|---|
| Essential product | Resilient demand |
| Long customer relationships | Recurring cash |
| Installed tanks/equipment | Switching friction |
| Delivery density | Scale economics |
| Telemetry | Predictable demand |
| Energy pass-through possibilities | Margin protection |
| High service importance | Premium value |
| Safety/quality requirements | Entry barriers |
| Applications know-how | Differentiation |
| On-site contracts | Long-duration cash flow |
Linde’s 2026 results demonstrate the economics of this model at scale: Q2 operating cash flow was $2.27 billion, with free cash flow of $833 million after $1.44 billion of capital expenditure; its contracted sale-of-gas backlog reached $8.1 billion. (Linde)
The lesson is not simply “invest more.”
It is:
CONTRACT THE CASH BEFORE COMMITTING THE CAPITAL.
3. DACH + CEE: THE MARKET REALITY
The regional opportunity should be viewed as two different economic systems.
DACH
Germany • Austria • Switzerland
Characteristics:
Mature industrial-gas penetration, sophisticated customers, high labor and energy costs, intense competition and stronger demand for productivity, decarbonization and supply security.
SFCF ROLE
CASH + TECHNOLOGY + PROOF BASE
Do not enter DACH primarily by chasing commodity volume.
Win through:
TCO → Reliability → Automation → Applications → Decarbonization → Contract Expansion.
CEE
Poland • Czechia • Slovakia • Hungary • Romania • Slovenia • Croatia + selected Southeast markets
Characteristics:
Manufacturing corridors, logistics investment, automotive ecosystems, food, metals, healthcare and continuing modernization.
SFCF ROLE
REPLICATION + DENSITY + SHARE-OF-WALLET GROWTH
Use proven DACH solutions and scale them through:
cluster density + standardized applications + telemetry + route economics + partnerships.
4. THE CURRENT 2026 SIGNAL
The large industrial-gas companies reveal the dominant management formula.
LINDE
Q2 2026 EMEA:
+2% pricing → lower volumes → +1% underlying sales.
This followed Q1 2026 EMEA where underlying sales had declined 2%, with 1% pricing and 3% lower volumes. (Linde)
Yet profitability remained exceptionally strong.
AIR LIQUIDE
In H1 2026 Air Liquide reported accelerating activity, material efficiency gains and higher operating margins, while cash generation strengthened. Its Q1 Industrial Merchant pricing was +3.4% globally and +1.7% in EMEA. (Air Liquide)
MESSER
Messer reported €4.5 billion 2025 revenue, €1.4 billion EBITDA and a 31% EBITDA margin, while emphasizing operational excellence, innovation and cash-generative capacity. (Messer) Messer also already provides tank-level monitoring, consumption statistics and low-level alerts—evidence that telemetry has become part of the competitive service architecture rather than an optional extra. (Messer)
SOL
SOL reached €1.776 billion of sales in 2025, up 10.3%, with EBITDA of €451.7 million and a 25.4% margin. Its Q1 2026 technical-gases sales rose 3.1%. (SOL Group)
NIPPON SANSO
Its European business also reported the same pattern during fiscal 2026: softer shipment volumes, with price management and productivity supporting earnings. (Nippon Sanso Holdings)
RAPIDKNOWHOW® INTERPRETATION
PRICE + PRODUCTIVITY + DIGITAL CONTROL ARE WINNING AGAINST PURE VOLUME.
5. THE FIVE INDUSTRIAL GAS FCF POOLS
The AI-Orchestrator should search for cash in this order.
FCF POOL 1 — PROTECT THE INSTALLED BASE
Before winning new customers:
stop losing value from existing customers.
Detect:
Contract leakage
Poor escalation
Unprofitable deliveries
Lost cylinders
Emergency deliveries
Tank imbalance
Underpriced services
Low asset utilization
Competitor penetration
ONE DECISION
Protect recurring cash before buying new revenue.
FCF POOL 2 — AUTOMATIC REPLENISHMENT™
Traditional model:
Customer checks tank → orders gas → supplier reacts.
SFCF model:
TELEMETRY → PREDICT → OPTIMIZE → DELIVER → VERIFY.
Economic impact:
Fewer emergency deliveries
Higher truck utilization
Lower stockouts
Lower scheduling effort
Higher customer reliability
Lower safety stock
Higher retention
CASH FLOW
BETTER DATA → BETTER ROUTE → LOWER COST → HIGHER SERVICE → HIGHER FCF.
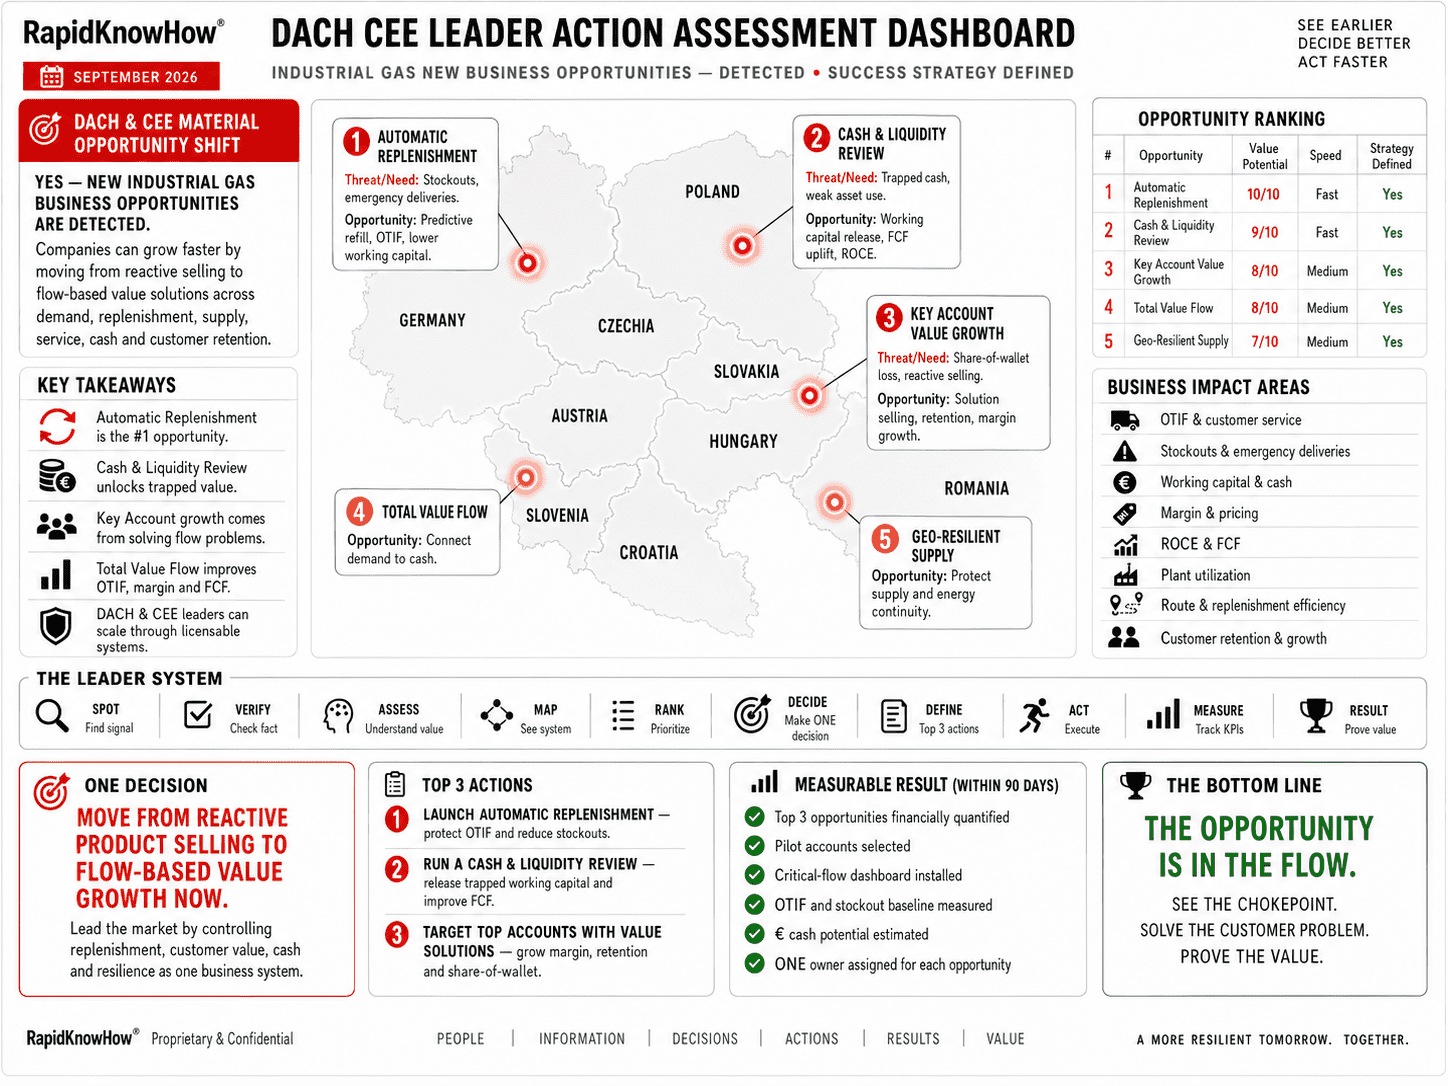
This should become the first DACH/CEE cross-market SFCF flagship.
FCF POOL 3 — SHARE-OF-WALLET
A customer buying oxygen may also consume:
Nitrogen
Argon
CO₂
Hydrogen
Helium
Specialty gases
Calibration mixtures
Cylinder gases
Dry ice
Equipment
Applications services
The lowest-capital growth opportunity is often already located inside an existing account.
AI QUESTION
What is the customer’s total industrial-gas wallet versus our current share?
Then:
CURRENT WALLET → GAP → APPLICATION → VALUE CASE → CONVERSION.
FCF POOL 4 — TCO-BASED CONVERSION
Do not sell:
€ / m³ gas.
Sell:
€ / UNIT OF CUSTOMER OUTPUT.
Example:
For a metal fabricator, optimize:
Gas price
Gas consumption
Cutting speed
Scrap
Labor
Downtime
Cylinder handling
Delivery cost
The competitor can beat the gas price and still lose the account if RapidKnowHow® demonstrates lower total process cost.
MASTER FORMULA
CUSTOMER TCO BEFORE
− CUSTOMER TCO AFTER
= VERIFIED CUSTOMER VALUE.
Part of that value can fund the commercial relationship.
FCF POOL 5 — CONTRACT-BACKED NEW GROWTH
Only after Pools 1–4:
On-site generation
New ASU capacity
Hydrogen projects
CO₂ infrastructure
Specialty-gas facilities
Electronics gases
Linde’s contracted project backlog model illustrates why large capital commitments become more attractive when future gas sales are contractually anchored. (Linde)
RAPIDKNOWHOW® RULE
CUSTOMER COMMITMENT BEFORE CAPITAL COMMITMENT.
6. TOP 10 SFCF OPPORTUNITIES 2026–2030
| Rank | Opportunity | FCF Speed | Capital Need | Strategic Priority |
|---|---|---|---|---|
| 1 | Automatic replenishment | Very High | Low | A+ |
| 2 | Existing-account share-of-wallet | Very High | Low | A+ |
| 3 | Pricing / contract optimization | Very High | Very Low | A+ |
| 4 | Distribution & route productivity | High | Low | A |
| 5 | Cylinder/asset productivity | High | Low–Medium | A |
| 6 | Customer TCO applications | High | Low | A |
| 7 | Healthcare/Home Oxygen linkage | High | Medium | A− |
| 8 | Specialty gases | Medium–High | Medium | A− |
| 9 | On-site gas supply | Medium | Medium–High | B+ |
| 10 | Hydrogen/CCUS mega-projects | Slow | Very High | Selective |
The EU’s Net-Zero Industry Act supports technologies including hydrogen, CCS, CO₂ transport/use and other industrial decarbonization technologies, creating a long-term opportunity pool—but these should be treated as selective contract-backed investments, not the first SFCF engine. (Intern. Markt, Industrie, Unternehm. und KMU)
7. COUNTRY PRIORITY SYSTEM
This is a RapidKnowHow® strategic prioritization, not a claim of country market size.
| Priority | Country | SFCF Role |
|---|---|---|
| 1 | 🇩🇪 Germany | Cash + technology + reference cases |
| 2 | 🇵🇱 Poland | Industrial growth + regional scale |
| 3 | 🇨🇿 Czechia | Dense industrial opportunity |
| 4 | 🇦🇹 Austria | High-value pilot + DACH/CEE bridge |
| 5 | 🇸🇰 Slovakia | Automotive/manufacturing cluster |
| 6 | 🇭🇺 Hungary | Industrial expansion corridor |
| 7 | 🇷🇴 Romania | Scale opportunity |
| 8 | 🇨🇭 Switzerland | Premium / specialty / healthcare |
| 9 | 🇸🇮 Slovenia | High-quality niche clusters |
| 10 | 🇭🇷 Croatia | Selective regional expansion |
THE CORRIDOR
GERMANY → POLAND / CZECHIA → AUSTRIA / SLOVAKIA → HUNGARY → ROMANIA
This becomes the SFCF growth spine.
8. AI-ORCHESTRATOR CONTROL LAYER
The system should not merely create dashboards.
It should continuously rank decisions.
INPUTS
Customer consumption
Tank levels
Cylinder movements
Delivery routes
Energy prices
Production availability
Contract conditions
Price changes
Customer profitability
Payment behavior
Competitor activity
Industry investments
Applications opportunities
↓
AI-ORCHESTRATOR
SCAN → VERIFY → RANK → CONNECT → DECIDE
↓
OUTPUT
ONE CUSTOMER
ONE VALUE LEAK
ONE OPPORTUNITY
ONE DECISION
TOP 3 ACTIONS
VERIFIED FCF
9. CUSTOMER SFCF ENGINE
For every strategic account:
CUSTOMER SALES
− Product cost
− Energy
− Distribution
− Cylinders/assets
− Service
− Working capital
− Account cost
=
CURRENT CUSTOMER FCF
Then identify:
PRICE OPPORTUNITY
PRODUCTIVITY OPPORTUNITY
SHARE-OF-WALLET OPPORTUNITY
ASSET OPPORTUNITY
APPLICATION VALUE
=
SFCF OPPORTUNITY POOL™
The AI-Orchestrator ranks accounts by:
€ VALUE × PROBABILITY × CASH SPEED ÷ CAPITAL REQUIRED.
10. THE SFCF GROWTH LADDER
LEVEL 1 — PROTECT
Keep profitable customers.
↓
LEVEL 2 — OPTIMIZE
Price, route, stock, cylinders and productivity.
↓
LEVEL 3 — EXPAND
Increase share-of-wallet.
↓
LEVEL 4 — LOCK IN
Telemetry + automatic replenishment + applications.
↓
LEVEL 5 — CONTRACT
Longer recurring agreements.
↓
LEVEL 6 — INVEST
Only into contract-backed growth.
↓
LEVEL 7 — REPLICATE
Account → Cluster → Country.
↓
LEVEL 8 — COMPOUND FCF.
11. CAPITAL ALLOCATION GATE
Every project must answer five questions.
CUSTOMER VALUE
Is measurable value created?
FCF SPEED
When does cash arrive?
CAPITAL INTENSITY
How much cash must be committed?
CONTRACT QUALITY
How much future demand is protected?
REPLICABILITY
Can the solution become reusable IP?
DECISION RULE
HIGH VALUE + FAST CASH + LOW CAPITAL = GO FIRST.
High value + slow cash + high capital:
CONTRACT FIRST.
Low value + high capital:
STOP.
12. THE THREE FLAGSHIP SFCF PRODUCTS
1. RapidKnowHow® AUTOMATIC REPLENISHMENT™
Protect the Gas Flow.
Tank → Telemetry → Prediction → Route → Delivery → OTIF → FCF.
2. RapidKnowHow® WIN NEXT HIGH-VALUE OPPORTUNITY™
Grow the Customer Wallet.
Account → Wallet → Competitor → Pain → Value → ONE Decision → Conversion.
3. RapidKnowHow® CASH & LIQUIDITY REVIEW™
Turn Operations into Cash.
Margin → Working Capital → Assets → Logistics → Pricing → FCF.
Together:
PROTECT CASH → WIN CASH → PROVE CASH.
13. 2026–2030 ROADMAP
2026 — BUILD
Install SFCF Command System.
Select:
20 value clusters
50 priority accounts
10 opportunities
3 proofs.
Goal:
VERIFIED CASH.
2027 — CONNECT
Connect:
Customer data
Telemetry
Contracts
Pricing
Routes
Applications
Competitor intelligence
Goal:
ONE CUSTOMER VALUE VIEW.
2028 — SCALE
Move proven SFCF models:
Germany/Austria → Poland/Czechia/Slovakia → Hungary/Romania.
Goal:
REPLICATION WITHOUT PROPORTIONAL OVERHEAD.
2029 — AUTOMATE
AI manages exceptions rather than people manually managing every transaction.
Goal:
MORE FCF PER MANAGEMENT HOUR.
2030 — COMPOUND
The portfolio becomes:
**Recurring contracts
- High retention
- Higher asset turns
- Lower working capital
- Reusable IP
- Selective contract-backed capacity.**
Goal:
SUSTAINED COMPOUNDING FCF.
14. COMMAND DASHBOARD — ONLY 10 NUMBERS
- Recurring FCF
- FCF/customer
- Share-of-wallet
- Customer retention
- Price realization
- OTIF
- Emergency deliveries
- Asset/cylinder turns
- Working capital
- ROCE
The critical relationship is:
FCF ↑ + ROCE ↑ + CUSTOMER TCO ↓
That is the industrial-gas win-win.
15. THE SFCF MULTIPLIER™
Formula
Verified Incremental Annual FCF
÷
Cash Required to Create It
Illustration only:
€3 million incremental FCF
÷ €1 million cash investment
=
3.0× SFCF MULTIPLIER
The AI-Orchestrator should continuously move resources toward the highest risk-adjusted SFCF multiplier.
16. RAPIDKNOWHOW® 90-DAY PROOF
DAYS 1–10 — SCAN
Select 20 accounts.
DAYS 11–20 — VALUE
Calculate customer and supplier FCF pools.
DAYS 21–30 — DECIDE
Select Top 3 cases.
DAYS 31–60 — ACT
Execute:
Replenishment
Pricing
Wallet conversion
DAYS 61–90 — PROVE
Finance verifies:
Baseline
Customer value
Incremental contribution
Working-capital effect
FCF
Then:
PROOF → CONTRACT → LICENSE → REPLICATION.
17. COMPETITIVE ADVANTAGE
Traditional industrial-gas management asks:
How much gas did we sell?
RapidKnowHow® asks:
HOW MUCH VERIFIED CASH DID THE CUSTOMER FLOW CREATE?
Traditional:
Product → Price → Volume
SFCF:
Customer Need → TCO → Reliability → Recurring Flow → Cash → ROCE
Traditional:
Invest → Sell → Recover
SFCF:
SELL VALUE → CONTRACT CASH → INVEST → COMPOUND.
18. BOARD DECISION
Do not launch another broad “DACH + CEE growth program.”
Launch:
RapidKnowHow® SFCF INDUSTRIAL GAS DACH + CEE SYSTEM™
with three Q4 2026 proofs:
PROOF 1
Automatic Replenishment
PROOF 2
Share-of-Wallet Expansion
PROOF 3
Cash + Liquidity Productivity
Measure all three against the same baseline.
Then use the winner’s verified FCF to finance the next deployment.
19. 2030 END STATE
The objective is not merely:
MORE REVENUE.
The objective is:
HIGHER CUSTOMER VALUE
↓
HIGHER RETENTION
↓
HIGHER SHARE-OF-WALLET
↓
BETTER ASSET PRODUCTIVITY
↓
HIGHER FCF
↓
SELF-FINANCED GROWTH
↓
HIGHER ROCE
↓
COMPOUNDING ENTERPRISE VALUE
RAPIDKNOWHOW® ONE DECISION
START WITH THE INSTALLED CUSTOMER BASE.
Do not begin by asking:
“Where should we build the next plant?”
Begin by asking:
“WHERE IS THE HIGHEST UNCAPTURED FCF INSIDE THE GAS FLOWS WE ALREADY CONTROL?”
Then:
FIND IT → WIN IT → PROVE IT → REINVEST IT → COMPOUND IT.
RapidKnowHow®
SELF-FINANCED FCF INDUSTRIAL GAS DACH + CEE SYSTEM™
Leave a Reply