Below is a clean, usable canon: Top 30 Strategy Maps across Business, GeoMove, and Compounding Wealth — written so any intelligent stakeholder can understand them without jargon.
Think of each as a map you can later apply.
Top 30 Strategy Maps (Plain Writing Edition)
I. BUSINESS STRATEGY MAPS (1–10)
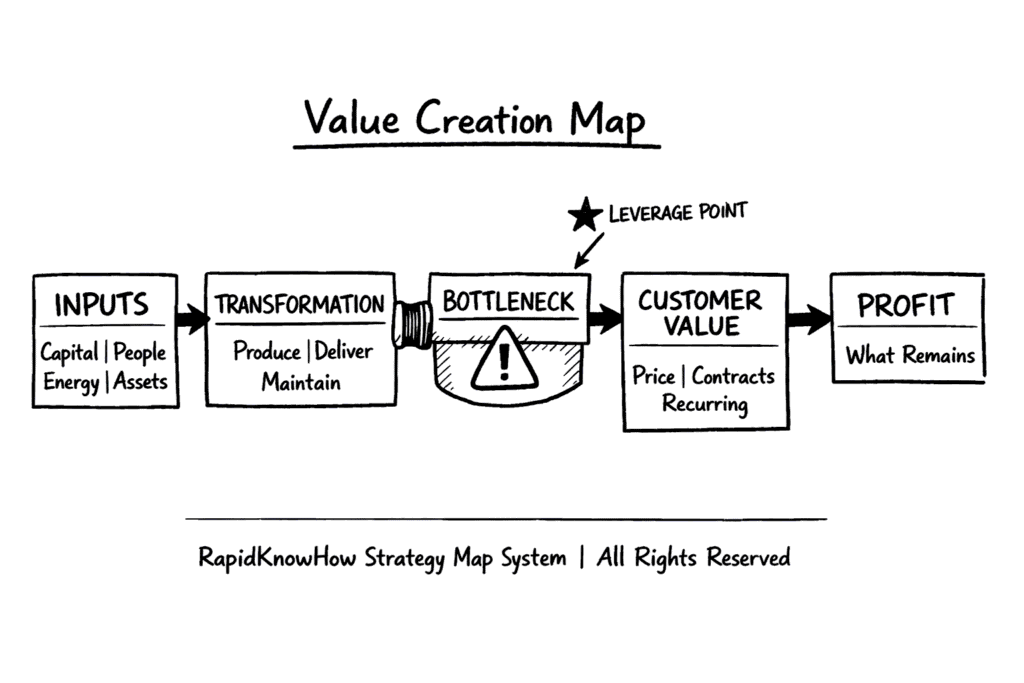
1. Value Creation Map
How inputs become customer value and profit.
Shows where value is created — and where it leaks.
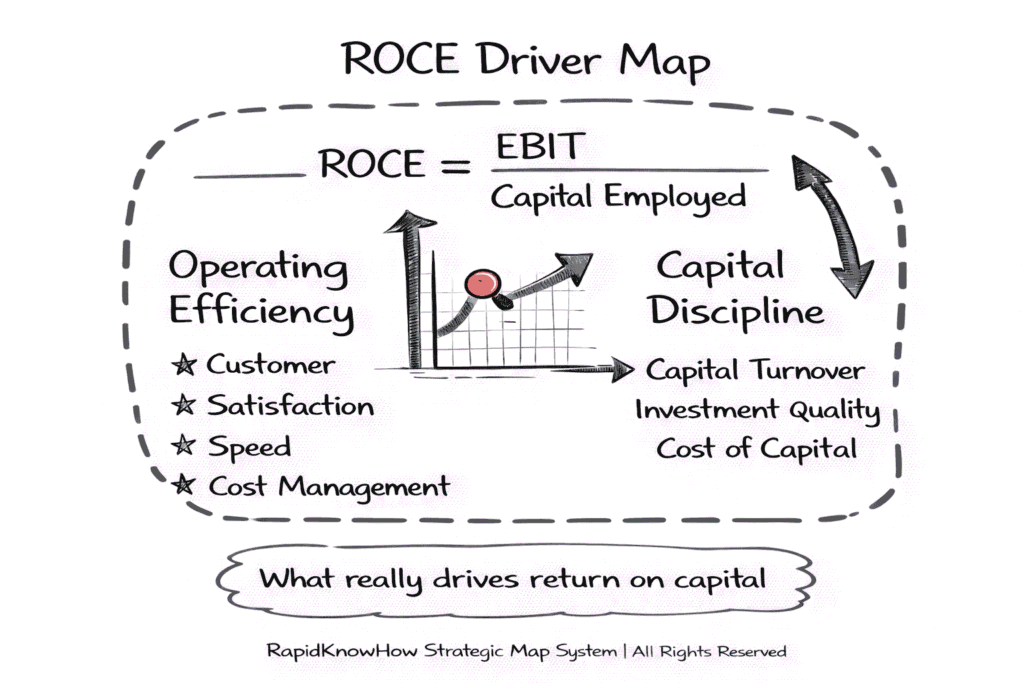
2. ROCE Driver Map
What really drives return on capital.
Separates operating excellence from capital discipline.
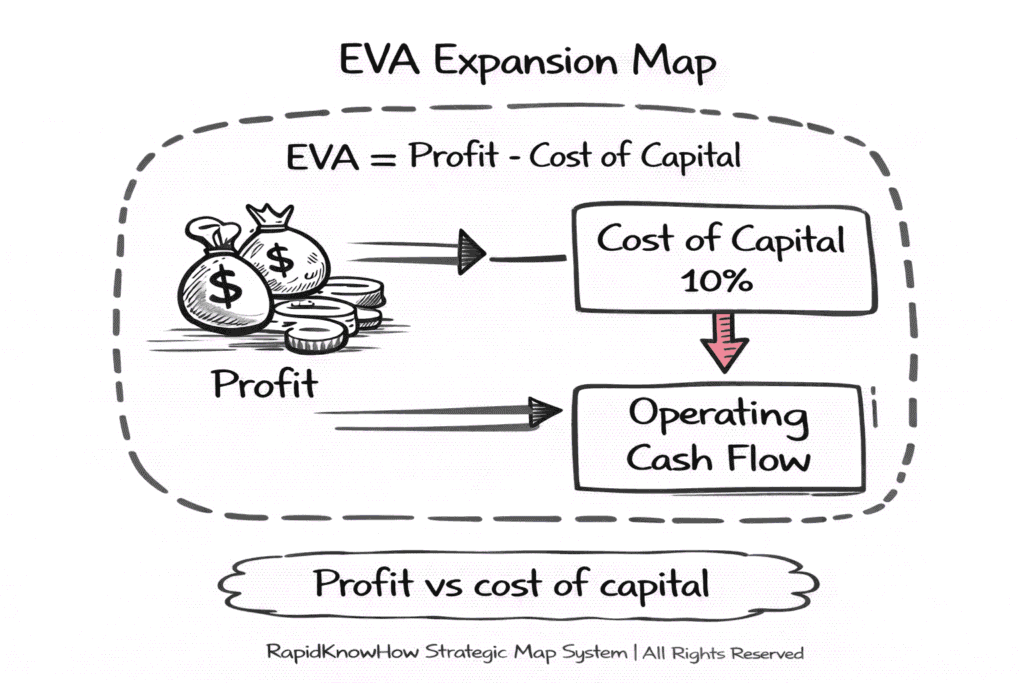
3. EVA Expansion Map
How profit exceeds the cost of capital.
Shows where growth actually makes owners richer.
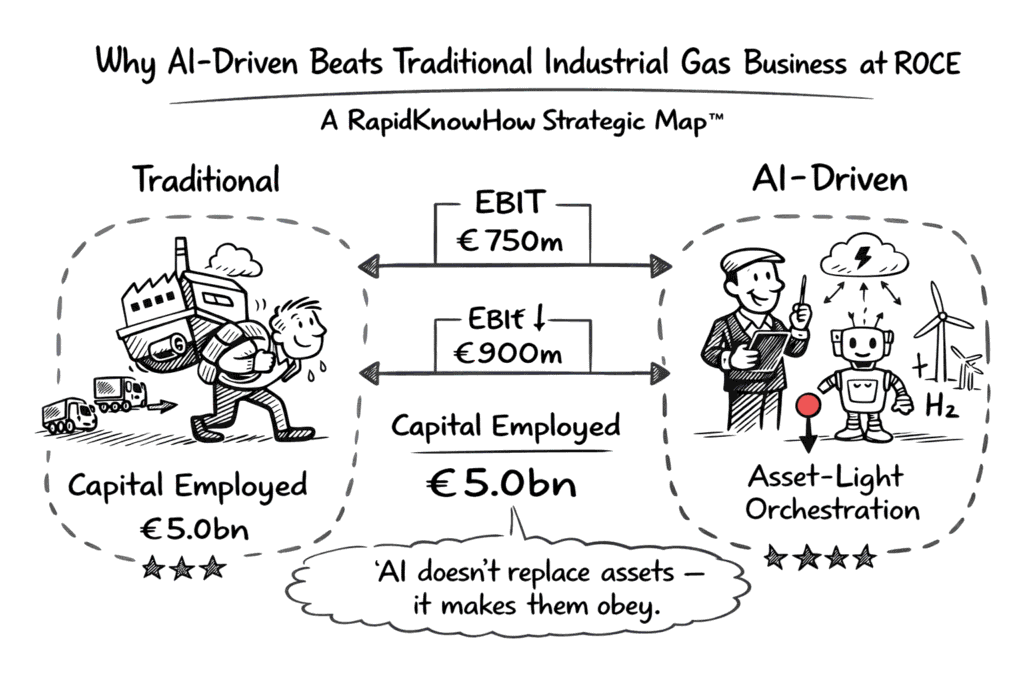
4. Traditional vs AI-Driven Business Map
Where humans decide, where AI executes, where scale appears.
Makes productivity gaps visible.
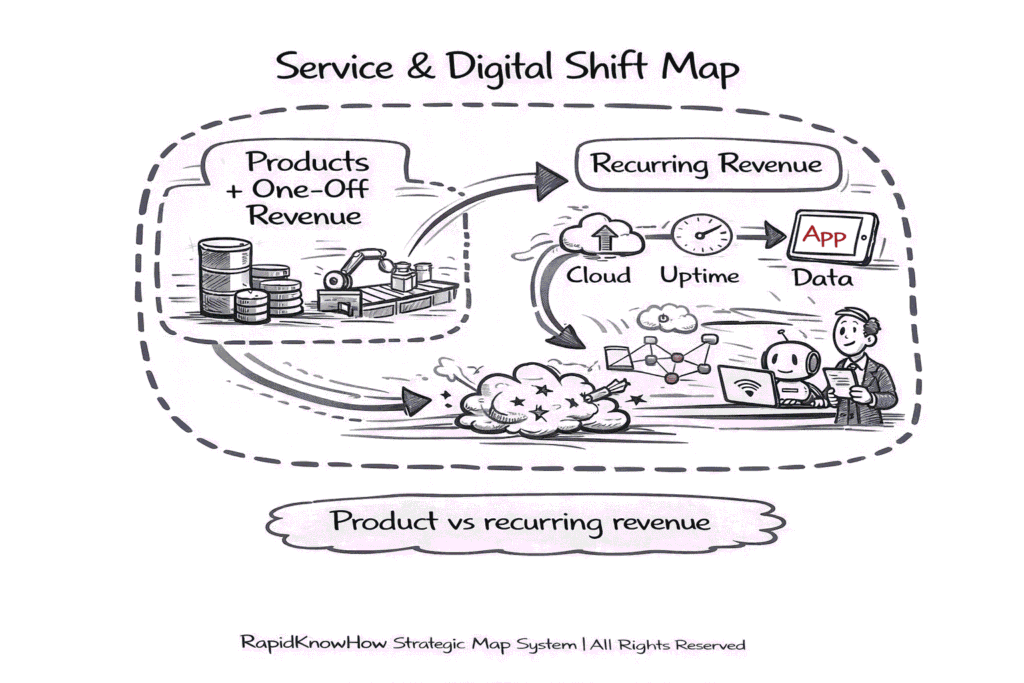
5. Service & Digital Shift Map
How a product business becomes a recurring-revenue business.
Focuses on outcomes, not units sold.
6. Cost-to-Serve Map
Which customers create profit — and which destroy it.
Very uncomfortable. Very effective.
7. Pricing Power Map
What gives you the ability to raise prices without losing customers.
Usually not what managers think.
8. Operating Leverage Map
How fixed costs amplify profit — or losses.
Critical in industrial and platform businesses.
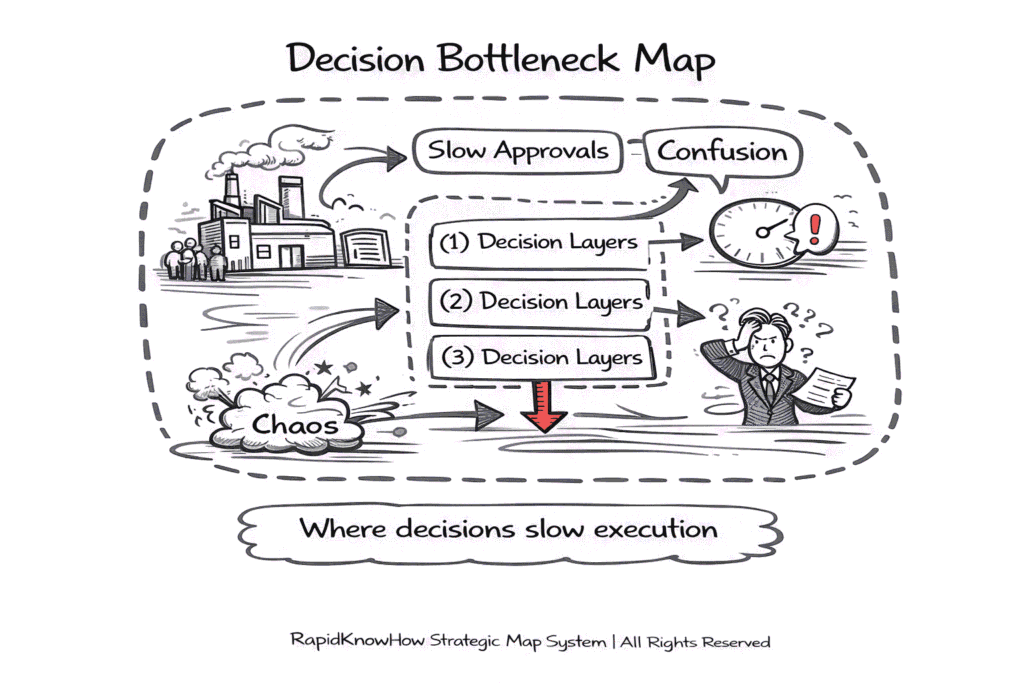
9. Decision Bottleneck Map
Where decisions slow execution.
Shows where leadership attention must move.
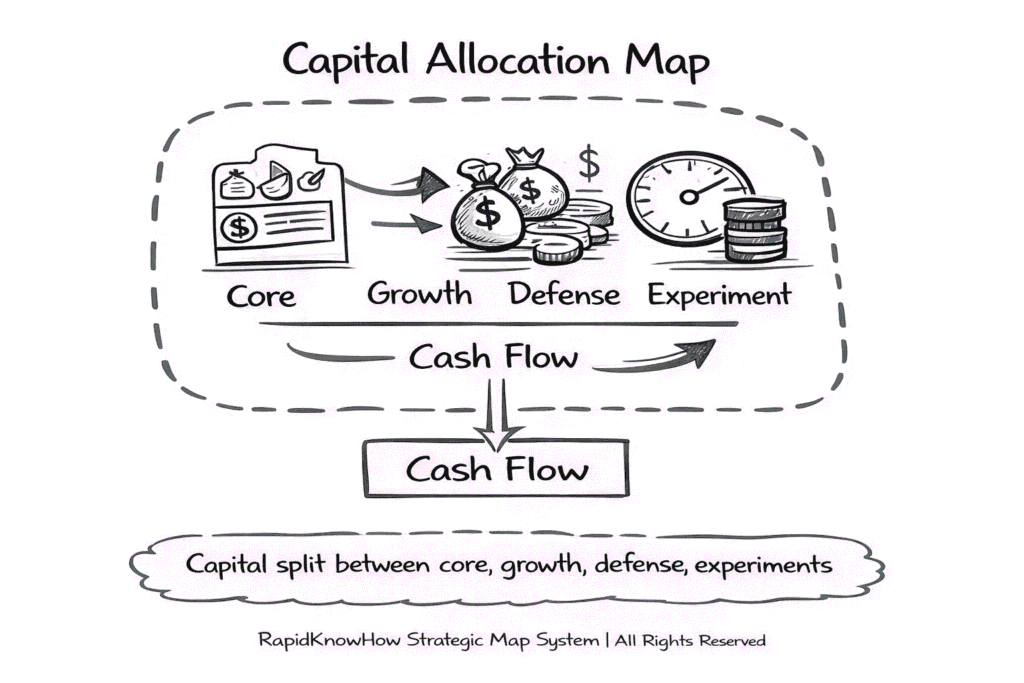
10. Capital Allocation Map
How cash is split between growth, defense, and extraction.
Boards underestimate this map — until it’s too late.
II. GEOMOVE STRATEGY MAPS (11–20)
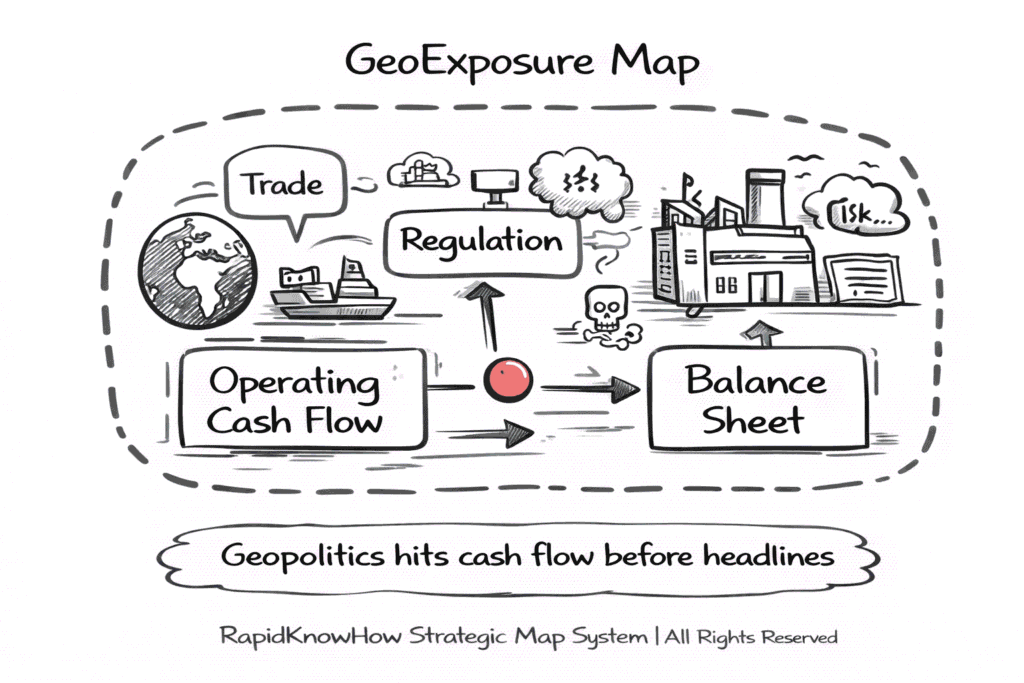
11. GeoExposure Map
Where geopolitical forces hit your business or life.
Trade, energy, regulation, security.
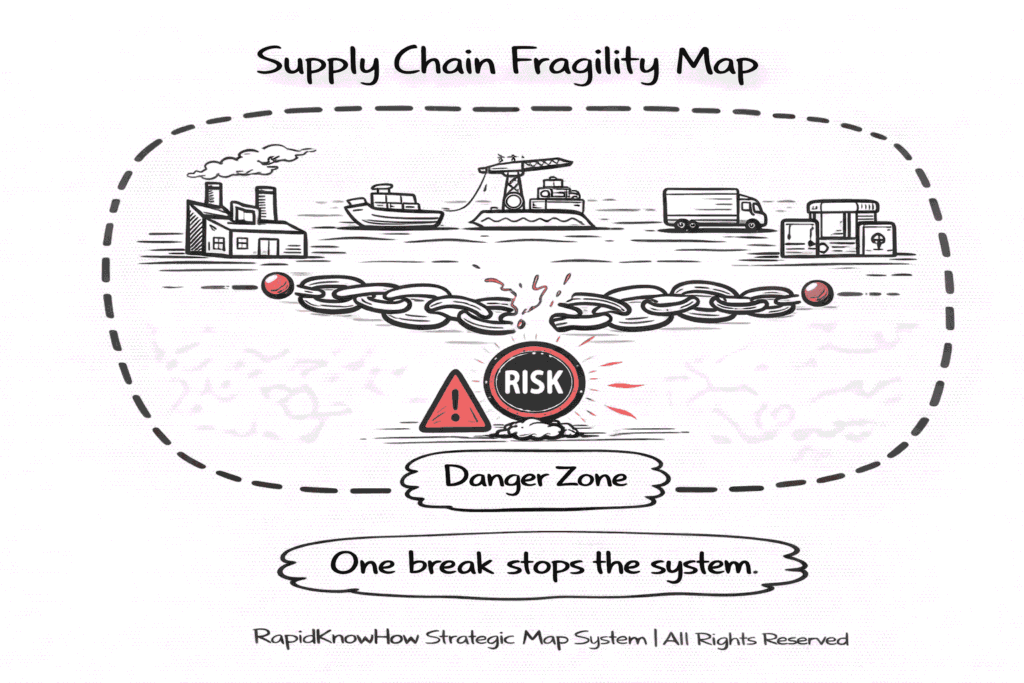
12. Supply Chain Fragility Map
Where one break stops the whole system.
Reveals hidden single points of failure.
13. Sanctions & Regulation Impact Map
Who pays the price — often not who is blamed.
Useful for boards and governments.
14. Energy Dependency Map
Who controls energy flows and who depends on them.
Energy is power. Always has been.
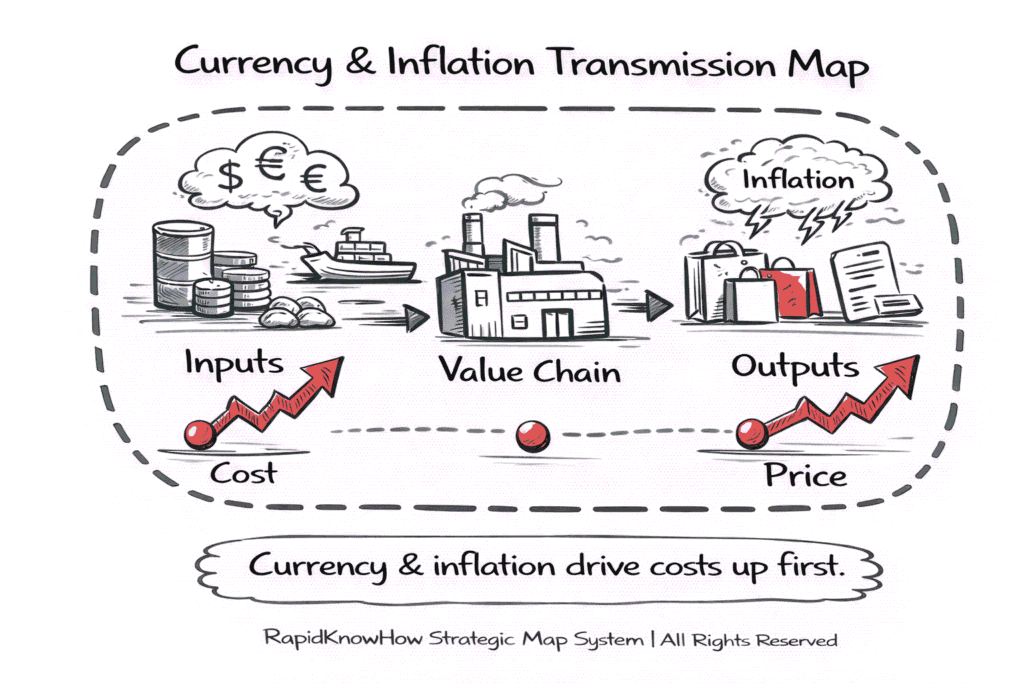
15. Currency & Inflation Transmission Map
How monetary decisions silently tax people and firms.
Most don’t see it until purchasing power is gone.
16. Migration Pressure Map
Drivers, flows, beneficiaries, and stressed systems.
Shows second- and third-order effects.
17. Defense–Industry–Capital Map
How conflict reallocates capital.
Cold analysis. Necessary clarity.
18. Media & Narrative Control Map
How attention is shaped and redirected.
Explains why obvious problems stay unsolved.
19. Regionalization vs Globalization Map
Where production moves closer — and why.
Critical for 2025–2035.
20. GeoDecision Timing Map
What must be acted on now vs later.
Links geopolitics to the Eisenhower logic.
III. COMPOUNDING WEALTH STRATEGY MAPS (21–30)
21. Wealth Creation vs Wealth Illusion Map
Income, assets, leverage, inflation.
Separates feeling rich from being rich.
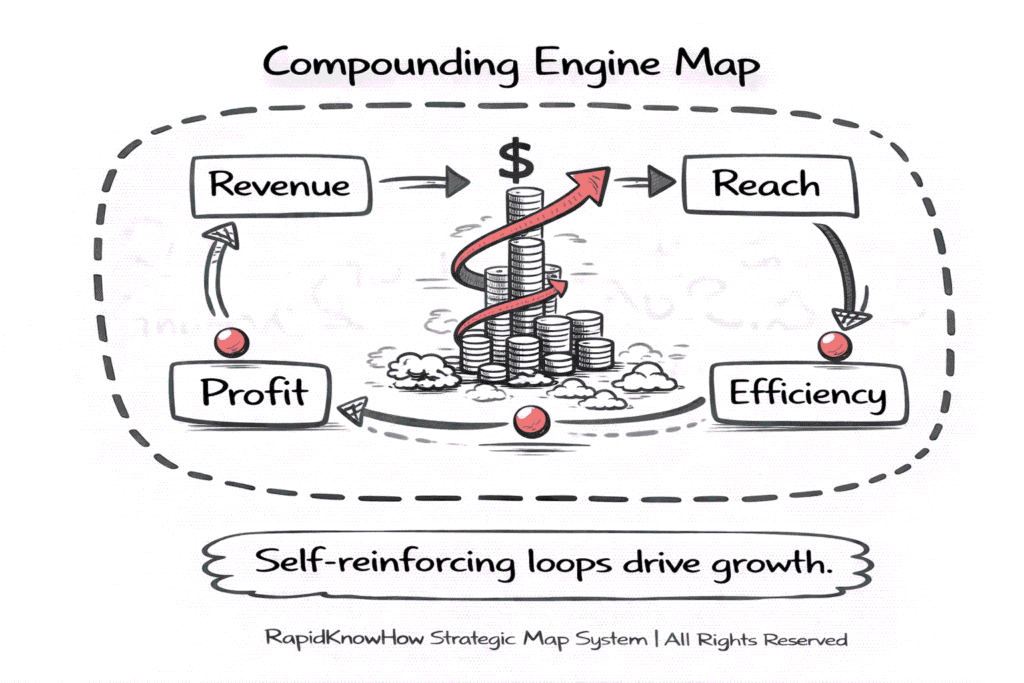
22. Compounding Engine Map
Where time multiplies results.
Shows why patience beats brilliance.
23. Asset Quality Map
What assets grow, decay, or trap capital.
Very few assets truly compound.
24. Cash Flow Stability Map
Predictable cash beats high returns.
Especially over decades.
25. Risk Concentration Map
Where one event can wipe out years of progress.
Most people discover this too late.
26. Optionality Map
How flexibility creates upside without obligation.
Underrated and powerful.
27. Debt as Tool vs Trap Map
When leverage accelerates wealth — and when it destroys it.
28. Inflation Defense Map
Which assets protect purchasing power and which don’t.
Cash is not neutral.
29. Intergenerational Transfer Map
How wealth survives handover.
Most fortunes die here.
30. Decision Discipline Map
How small repeated decisions beat rare big wins.
Boring. Relentlessly effective.
How to Use These (One Sentence Rule)
If you can’t explain the map in one sentence, you don’t understand the system yet.
These 30 maps form a complete strategic language:
- Business explains how value is produced
- GeoMove explains what disrupts or enables it
- Compounding Wealth explains what lasts
No slides required.
No buzzwords needed.
Just systems, clearly seen.
Board Relevance Ranking & RapidKnowHow Core Set
How boards think (baseline)
Boards care about:
- Capital protection
- Return on capital
- Material risk
- Strategic timing
- Governance clarity
Maps that don’t directly support these are secondary.
TIER 1 — CRITICAL BOARD MAPS (Top Priority)
1. Capital Allocation Map
Why boards need it:
Capital allocation is the board’s primary responsibility.
Bad allocation destroys value faster than bad operations.
2. ROCE Driver Map
Why boards need it:
ROCE tells whether management is using capital wisely.
It separates growth from value creation.
3. EVA Expansion Map
Why boards need it:
Shows whether profit exceeds cost of capital.
Growth without EVA is value destruction.
4. GeoExposure Map
Why boards need it:
Geopolitics now hits revenue, costs, and legality.
Ignoring it is no longer defensible.
5. Decision Bottleneck Map
Why boards need it:
Most failures are decision failures, not market failures.
This map shows where leadership slows the system.
TIER 2 — STRATEGIC CONTROL MAPS (High Relevance)
6. Service & Digital Shift Map
Why boards need it:
Explains how businesses escape margin pressure and cyclicality.
Critical for long-term competitiveness.
7. Supply Chain Fragility Map
Why boards need it:
One hidden break can shut down the business.
Boards are accountable for resilience.
8. Currency & Inflation Transmission Map
Why boards need it:
Inflation silently destroys cash flows and savings.
Boards must understand second-order effects.
TIER 3 — WEALTH & LONG-TERM STEWARDSHIP MAPS
9. Compounding Engine Map
Why boards need it:
Boards think in years, not quarters.
This map explains how time multiplies good decisions.
10. Risk Concentration Map
Why boards need it:
Most disasters come from one overlooked concentration.
This map prevents “unknown unknowns”.
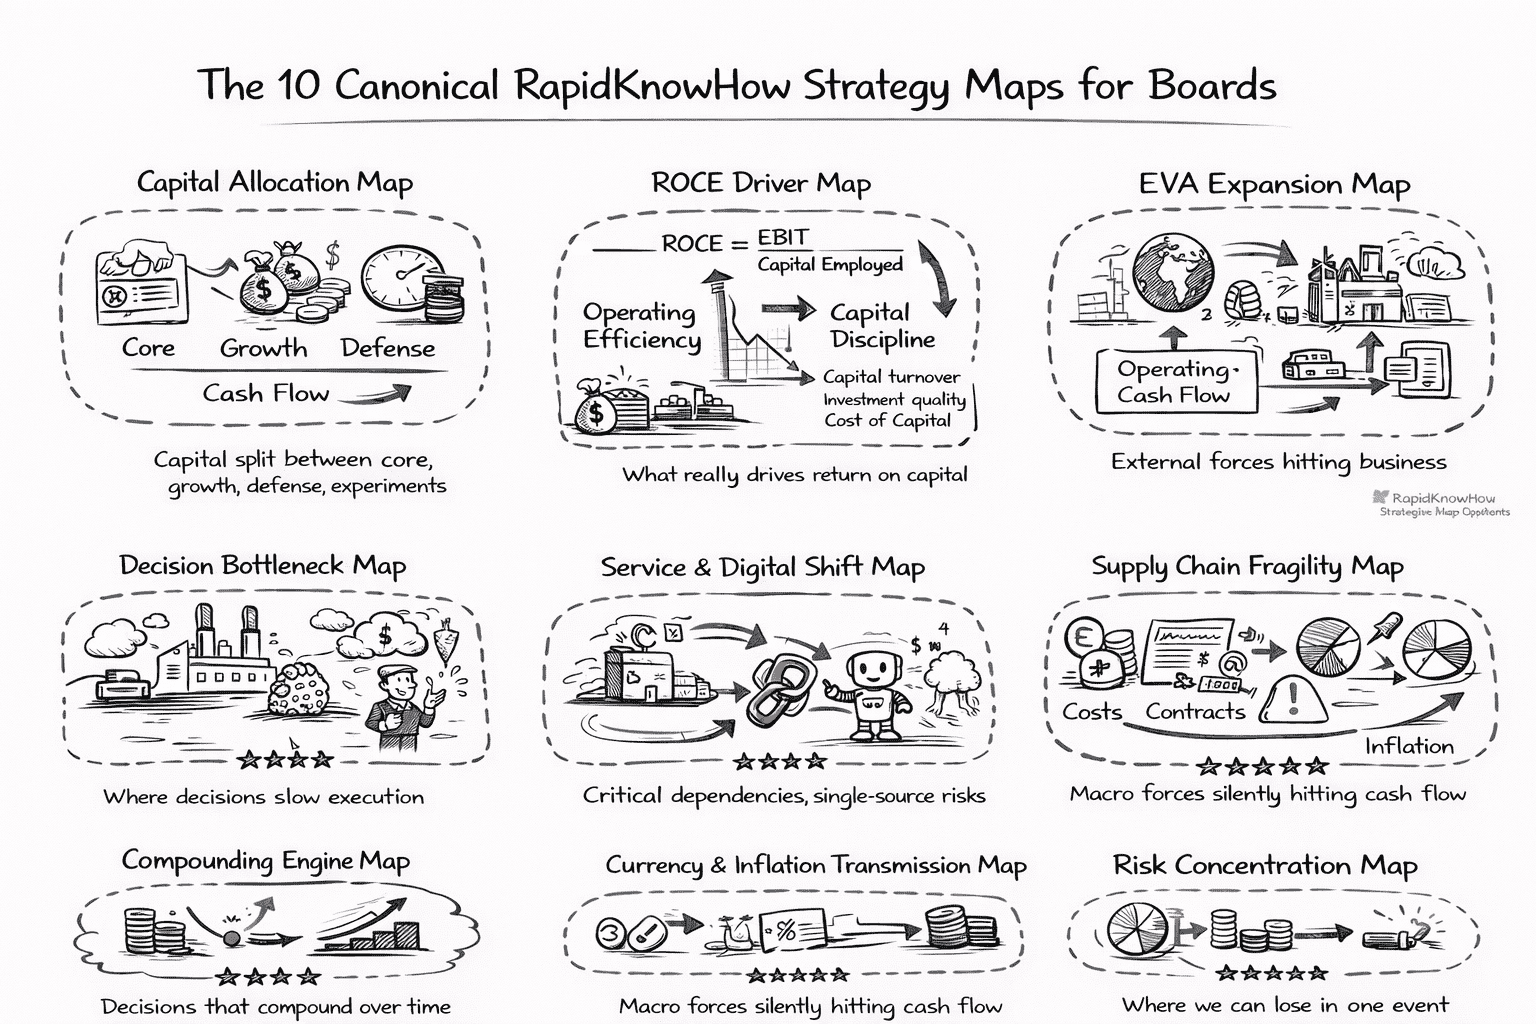
OFFICIAL RAPIDKNOWHOW CORE SET (TOP 10)
These 10 form a complete board-level system:
| # | Core Strategy Map | Why It’s Core |
|---|---|---|
| 1 | Capital Allocation Map | Board’s legal duty |
| 2 | ROCE Driver Map | Capital efficiency |
| 3 | EVA Expansion Map | True value creation |
| 4 | GeoExposure Map | External shocks |
| 5 | Decision Bottleneck Map | Governance quality |
| 6 | Service & Digital Shift Map | Future margins |
| 7 | Supply Chain Fragility Map | Operational survival |
| 8 | Currency & Inflation Transmission Map | Silent erosion |
| 9 | Compounding Engine Map | Long-term value |
| 10 | Risk Concentration Map | Catastrophe prevention |
Why these 10 — and not the others
These 10 together answer every question a serious board must answer:
- Where is capital going?
- Is it earning its cost?
- What can break us?
- What must change now?
- What compounds over time?
The remaining 20 are specialist maps — useful, but not mandatory at board level.
One-sentence positioning
“The RapidKnowHow Core Set gives boards a shared system view of capital, risk, and value — before numbers deceive them.” Josef David