
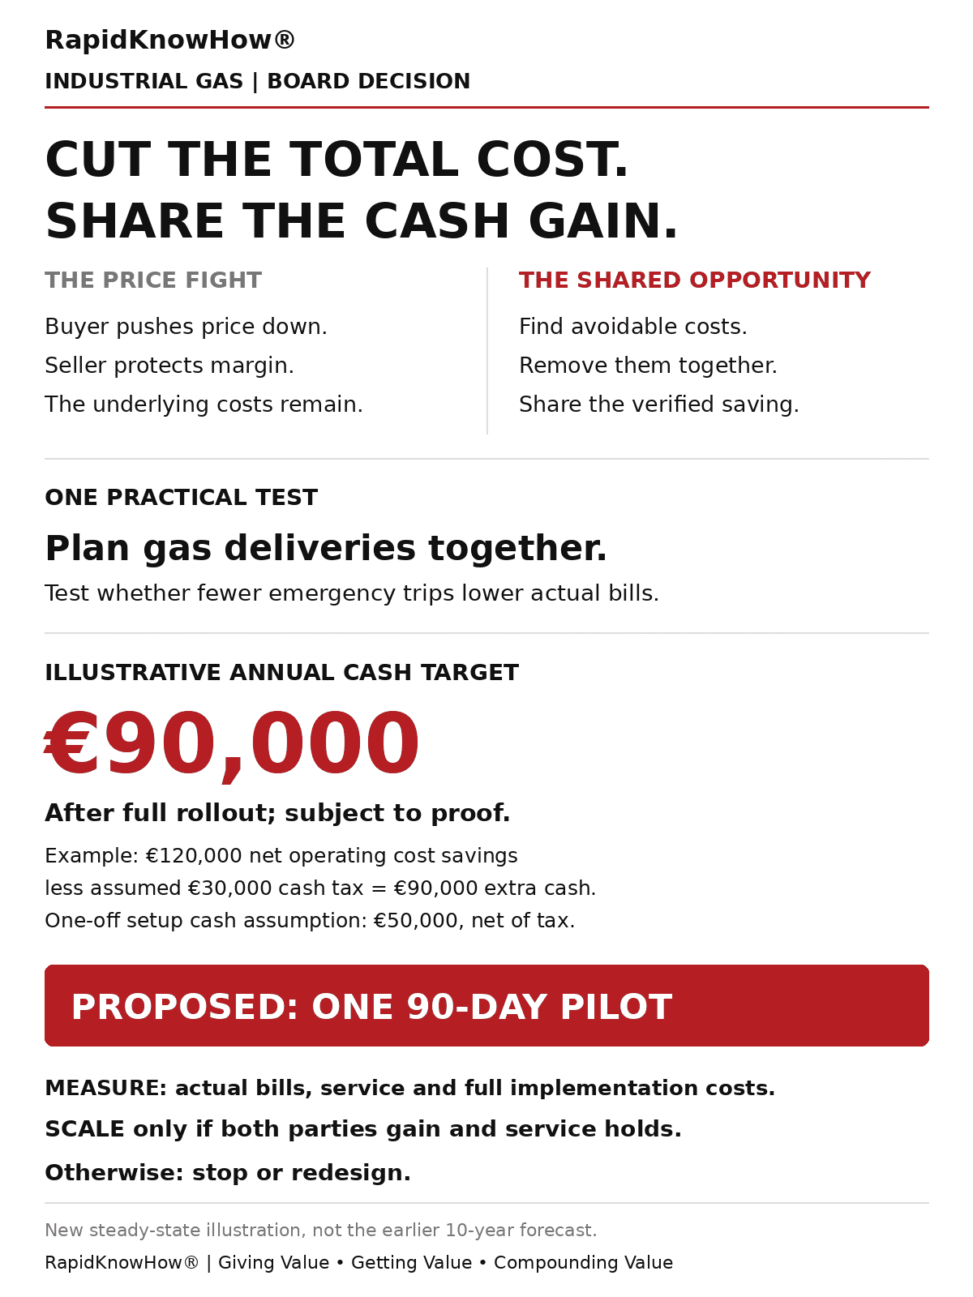
Price fight versus buyer + seller value creation. Illustrative assumptions, not verified results.
1. Define one boundary
Model the combined operating activity of one buyer and its gas supplier. Its external customer revenue is €1,000,000 a year. Eliminate their internal gas invoice. A €10,000 price concession is a transfer between the parties, not a €10,000 joint saving. Output and accepted quality are equal in both models. This is a selected joint operating activity, not either company’s full financial statements.
2. Establish the baseline
Annual external cash operating costs €800,000; depreciation €50,000; operating profit before interest and tax €150,000; assumed cash tax 25% (€37,500); annual capital spending €50,000; working-capital increase zero; average capital employed €750,000. Annual free cash flow is €112,500 and return on capital employed is 20%.
3. Change the operating process
Test consolidated deliveries, fewer emergency trips, efficient gas use and lower rework or downtime costs. Count only net, independently supported savings in external cash costs. Avoid double counting a cost reduction and the same benefit as extra revenue. No extra sales are assumed. All recurring program costs are already netted from the assumed savings.
The joint model has one €50,000 after-tax implementation cash outflow at time zero, expensed then, with no residual asset. No tax benefit is added again. Average capital stays €750,000; maintenance investment equals depreciation. Savings do not imply a release of capital in this example.
4. Calculate the annual cash bridge
All values below are €000 except returns. Operating profit = revenue − external cash costs − depreciation. Free cash flow = operating profit × (1 − cash tax rate) + depreciation − capital spending − increase in working capital. Return on capital employed = operating profit / average capital employed.
| Year | Net pre-tax savings | Operating profit | Cash tax | Annual free cash flow | ROCE | Cum cash after setup |
|---|---|---|---|---|---|---|
| 1 | 20.00 | 170.00 | 42.50 | 127.50 | 22.67% | 77.50 |
| 2 | 35.00 | 185.00 | 46.25 | 138.75 | 24.67% | 216.25 |
| 3 | 50.00 | 200.00 | 50.00 | 150.00 | 26.67% | 366.25 |
| 4 | 65.00 | 215.00 | 53.75 | 161.25 | 28.67% | 527.50 |
| 5 | 80.00 | 230.00 | 57.50 | 172.50 | 30.67% | 700.00 |
| 6 | 90.00 | 240.00 | 60.00 | 180.00 | 32.00% | 880.00 |
| 7 | 100.00 | 250.00 | 62.50 | 187.50 | 33.33% | 1067.50 |
| 8 | 110.00 | 260.00 | 65.00 | 195.00 | 34.67% | 1262.50 |
| 9 | 115.00 | 265.00 | 66.25 | 198.75 | 35.33% | 1461.25 |
| 10 | 120.00 | 270.00 | 67.50 | 202.50 | 36.00% | 1663.75 |
The price-fight baseline remains €112.5k annual free cash flow and 20% return in each year. Its cumulative cash is €337.5k, €562.5k and €1,125k at years 3, 5 and 10. Joint cumulative cash is €366.25k, €700k and €1,663.75k, after initial setup. Gains are €28.75k, €137.5k and €538.75k. This is undiscounted cash generated, not enterprise value.
5. Estimate enterprise value consistently
Use an assumed 10% cost of capital for both models. End-of-year enterprise value equals the present value, at that date, of future unlevered free cash flows from the following year onward. Use the remaining stated annual forecast through year 10, then zero growth forever at the year-10 cash level. Terminal enterprise value at year 10 = year-11 free cash flow / 10%.
The baseline is €112.5k / 10% = €1,125k at each date. The joint model is €1,928.783k at year 3, €1,983.953k at year 5 and €2,025k at year 10. Year-3 value already includes expectations of later savings; it is not derived from year-3 cash alone. Past implementation cost is not deducted again at later valuation dates. Accumulated cash is excluded from enterprise value; do not add it to imply operating value creation.
For reference, modeled value today is €1,742.399k after the initial €50k implementation payment, versus €1,125k baseline. These are conditional scenario values, not market appraisals. Zero terminal growth still assumes perpetual maintenance, demand and the year-10 cash saving; test that assumption and discount-rate sensitivity before use.
6. Share verified value and pilot first
Agree a shared cost baseline, evidence sources, responsibilities and service standards. Run one 90-day pilot. Reconcile bills, gas usage and service performance; include all operating and implementation costs. Share verified net gains under a written rule. The combined model does not allocate gains, tax effects or capital between the buyer and seller; model each party separately before contracting. Scale only after both can demonstrate a benefit.
Method sources
Case inputs and savings are illustrative assumptions; the sources support calculation methods only.
- ACCA: Return on capital employed — https://www.accaglobal.com/gb/en/student/exam-support-resources/fundamentals-exams-study-resources/f2/technical-articles/ratio-analysis.html
- Aswath Damodaran, NYU Stern: Firm valuation — https://pages.stern.nyu.edu/~adamodar/New_Home_Page/background/valintro.htm
- Aswath Damodaran, NYU Stern: Terminal value — https://pages.stern.nyu.edu/~adamodar/New_Home_Page/valquestions/termvalapproaches.htm