
INDUSTRIAL GAS — POWER REPORT 2026
CORE IDEA
Industrial Gas companies do not compound Free Cash Flow simply by owning more assets.
They compound Free Cash Flow when they systematically improve the economic productivity of the assets they already own and reinvest only into proven high-value configurations.
The core logic is:
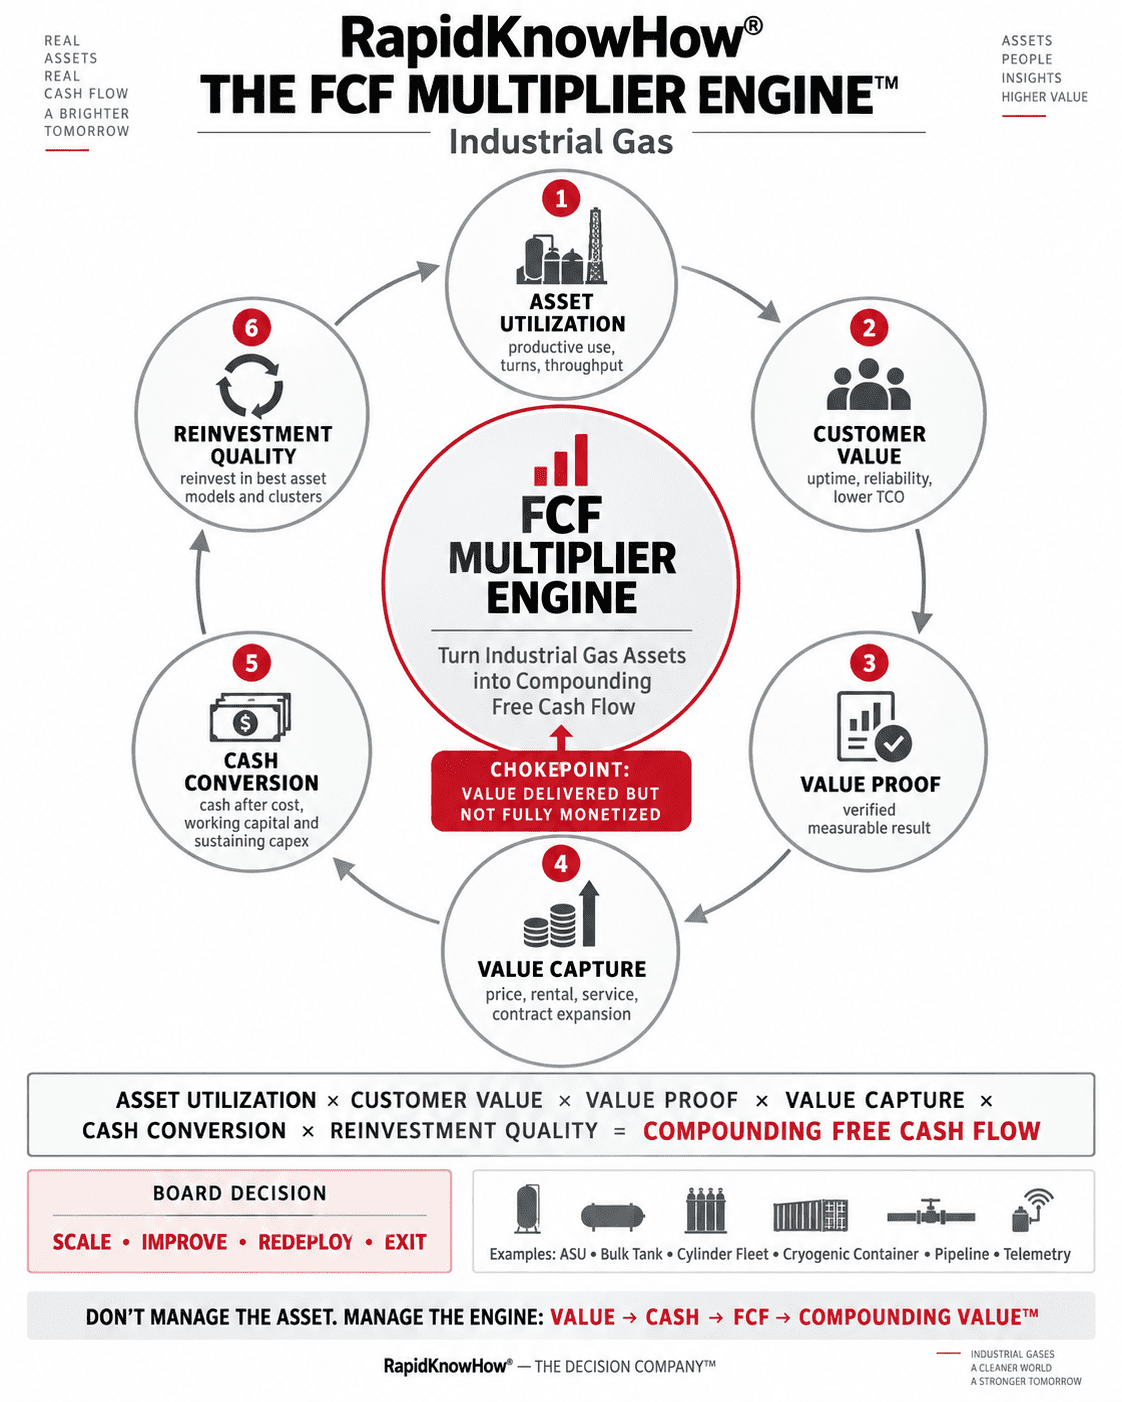
ASSET UTILIZATION × CUSTOMER VALUE × VALUE PROOF × VALUE CAPTURE × CASH CONVERSION × REINVESTMENT QUALITY = COMPOUNDING FCF
The objective is not:
MORE ASSETS.
The objective is:
MORE FCF FROM EVERY EURO OF CAPITAL EMPLOYED.
1. THE FCF MULTIPLIER ENGINE™
The engine consists of six linked multipliers.
1 — ASSET UTILIZATION
Put invested capital into productive use.
Industrial Gas examples:
- ASU capacity utilization
- tonnes per bulk tank
- cylinder turns
- cryogenic container productive days
- trailer utilization
- filling-plant throughput
- pipeline loading
- delivery-route density
The first question is:
HOW MUCH PRODUCTIVE OUTPUT DO WE CREATE FROM THE CAPITAL ALREADY EMPLOYED?
Unused capacity is not only an operating issue.
It is trapped capital.
2 — CUSTOMER VALUE
Utilization alone is not enough.
The asset must deliver an economically meaningful customer result.
Industrial Gas value typically includes:
- supply reliability
- production uptime
- productivity improvement
- lower TCO
- lower energy consumption
- lower inventory
- fewer emergency deliveries
- lower handling requirements
- reduced product losses
- improved product quality
- improved working capital
- stronger supply resilience
Therefore:
ASSET UTILIZATION MUST BECOME CUSTOMER VALUE.
A fully utilized asset serving low-value demand can still be economically inferior to an asset embedded in a high-value customer process.
3 — VALUE PROOF
Customer value must become measurable.
Without proof, value remains a commercial claim.
With proof, it becomes a management asset.
Examples:
Before → After
Emergency deliveries:
12 → 2
Tank stock-outs:
4 → 0
Production interruption:
6 hours → 0
Energy cost:
€X → €Y
Gas consumption per finished unit:
X → Y
Inventory requirement:
X days → Y days
Customer TCO:
€X → €Y
The objective is:
TURN CUSTOMER BENEFIT INTO VERIFIED ECONOMIC EVIDENCE.
This is the bridge between operational performance and commercial value capture.
4 — VALUE CAPTURE
This is often the critical Industrial Gas chokepoint.
The supplier may create substantial customer value through:
- installed capital
- logistics
- security of supply
- application engineering
- process expertise
- telemetry
- automatic replenishment
- emergency capability
- service infrastructure
but still monetize primarily:
€/kg
or
€/Nm³
That produces the central leakage:
VALUE DELIVERED BUT NOT FULLY MONETIZED.
Value capture can come through:
- appropriate pricing
- equipment rental
- service fees
- contract duration
- premium reliability offers
- automatic replenishment
- application services
- multi-site expansion
- increased share of wallet
- value-sharing mechanisms
The question changes from:
“What price can we charge for the gas?”
to:
“WHAT FAIR SHARE OF THE VERIFIED ECONOMIC VALUE SHOULD FLOW BACK TO THE SUPPLIER?”
5 — CASH CONVERSION
Commercial value does not equal Free Cash Flow.
The value captured must survive the full cash-cost structure.
Industrial Gas cash logic
Revenue
− production cash cost
− energy cash cost
− distribution cash cost
− service cost
− maintenance cash cost
− working-capital increase
− sustaining CAPEX
=
FREE CASH FLOW
Management should therefore measure not only:
- revenue
- EBITDA
- margin
but increasingly:
FCF PER CUSTOMER
FCF PER ASSET
FCF PER ROUTE
FCF PER CLUSTER
FCF PER € CAPITAL EMPLOYED
That exposes which configurations truly create cash.
6 — REINVESTMENT QUALITY
This is where FCF becomes compounding FCF.
Producing cash is not enough.
Management must reinvest cash into opportunities with superior economics.
Typical reinvestment targets include:
- high-turn bulk tanks
- automatic replenishment
- telemetry
- dense delivery clusters
- debottlenecking
- application engineering
- high-value customer processes
- proven cylinder segments
- multi-site expansion
- profitable on-site capacity
- scalable regional business models
The key question becomes:
WHERE DOES THE NEXT €1 OF CAPITAL CREATE THE MOST SUSTAINABLE FCF?
Poor reinvestment destroys the multiplier.
High-quality reinvestment strengthens it.
7. WHY IT IS A MULTIPLIER — NOT A CHECKLIST
The six elements interact.
Consider:
High Utilization
× Weak Customer Value
× Weak Value Proof
× Weak Value Capture
× Good Cash Conversion
× Poor Reinvestment
The overall FCF engine remains weak.
The system is only as strong as its weakest multiplier.
Therefore the strategic job is:
FIND THE WEAKEST MULTIPLIER.
Then:
REMOVE THE CHOKEPOINT.
Do not improve all six factors equally.
Improve the factor currently limiting cash productivity.
8. INDUSTRIAL GAS EXAMPLE — BULK TANK SYSTEM
Consider a bulk liquid customer.
ASSET UTILIZATION
Increase tank turns.
↓
CUSTOMER VALUE
Improve supply reliability and reduce customer inventory.
↓
VALUE PROOF
Quantify:
- fewer emergency deliveries
- lower inventory
- lower administration
- avoided production disruption
↓
VALUE CAPTURE
Improve:
- rental
- service value
- contract structure
- gas volume
- customer expansion
↓
CASH CONVERSION
Optimize:
- delivery frequency
- truck kilometers
- drop size
- working capital
- maintenance
↓
REINVESTMENT QUALITY
Deploy FCF into similar high-value customers in the same cluster.
Result:
ONE PROFITABLE TANK MODEL BECOMES A REPEATABLE FCF ENGINE.
9. THE CLUSTER MULTIPLIER™
The multiplier becomes even stronger when assets are managed as a geographic system rather than independently.
Example:
MORE PROFITABLE CUSTOMERS IN ONE CLUSTER
↓
higher tank density
↓
higher route density
↓
larger average drops
↓
lower delivery cost per tonne
↓
better fleet utilization
↓
higher FCF
↓
more attractive local customer acquisition
↓
even greater density
↓
CLUSTER-LEVEL FCF COMPOUNDING
This converts individual customer wins into system economics.
10. THE CUSTOMER MULTIPLIER™
A high-quality customer relationship can also compound.
Start with:
ONE GAS APPLICATION
↓
prove customer value
↓
expand application
↓
install additional equipment
↓
add product
↓
add site
↓
add region
↓
extend contract
↓
increase share of wallet
↓
MORE CUSTOMER LIFETIME FCF
The customer becomes a value platform rather than a transaction.
11. THE ASSET MULTIPLIER™
A productive asset can create several layers of return.
Example:
Bulk Tank
does not only create rental income.
It can enable:
- recurring gas sales
- customer retention
- delivery density
- application expansion
- contract extension
- telemetry data
- automatic replenishment
- lower service cost
- customer lifetime value
Therefore:
THE ECONOMIC VALUE OF AN ASSET IS GREATER THAN ITS DIRECT REVENUE STREAM.
Management should evaluate the entire value system enabled by the asset.
12. THE BIGGEST FCF LEAKS™
Five common leaks destroy multiplier power.
LEAK 1 — IDLE CAPITAL
Low utilization.
Response: Improve, redeploy or exit.
LEAK 2 — VALUE WITHOUT PROOF
Customer receives benefits but they are not quantified.
Response: Establish value evidence.
LEAK 3 — VALUE WITHOUT CAPTURE
Supplier delivers high value but monetizes only commodity volume.
Response: Redesign the commercial model.
LEAK 4 — PROFIT WITHOUT CASH
Margin looks attractive but working capital and sustaining CAPEX consume cash.
Response: Manage cash conversion.
LEAK 5 — CASH WITHOUT DISCIPLINED REINVESTMENT
FCF is reinvested into low-return expansion.
Response: Allocate capital only to proven FCF engines.
13. THE FCF MULTIPLIER SCORECARD™
Every important asset system should be scored across six dimensions.
| MULTIPLIER | BOARD QUESTION |
|---|---|
| Asset Utilization | Is the capital working hard enough? |
| Customer Value | Does the asset create important measurable value? |
| Value Proof | Can we prove that value economically? |
| Value Capture | Are we monetizing a fair share? |
| Cash Conversion | Does captured value become FCF? |
| Reinvestment Quality | Can we reproduce superior returns? |
The board should then identify:
ONE WEAKEST MULTIPLIER
and make:
ONE DECISION
14. THE FOUR CAPITAL DECISIONS™
Every asset system ultimately receives one of four actions:
SCALE
High value + strong FCF + repeatable economics.
Allocate more capital.
IMPROVE
Strong customer value but weak economics.
Fix the chokepoint.
REDEPLOY
Good asset but poor current application, customer or geography.
Move the capital.
EXIT
Low value + low FCF + weak future economics.
Release the capital.
15. THE BOARD CONTROL LOOP™
The board should operate the FCF Multiplier Engine through one repeating sequence:
SIGNAL
Which multiplier is weakening?
↓
INTERPRET
Why is it limiting FCF?
↓
DECIDE
Scale, Improve, Redeploy or Exit?
↓
ACT
Execute the Top 3 actions.
↓
PROVE
Measure verified FCF improvement.
↓
REINVEST
Allocate capital to the strongest proven engine.
↓
COMPOUND
Repeat.
16. THE STRATEGIC FORMULA™
INDUSTRIAL GAS FCF MULTIPLIER™
ASSET UTILIZATION
× CUSTOMER VALUE
× VALUE PROOF
× VALUE CAPTURE
× CASH CONVERSION
× REINVESTMENT QUALITY
=
COMPOUNDING FREE CASH FLOW
The objective is not to maximize one variable.
The objective is to create a system where every variable strengthens the next.
17. FROM ASSET MANAGEMENT TO CAPITAL ORCHESTRATION
Traditional management:
BUY ASSET
→ operate
→ maintain
→ depreciate
→ replace.
RapidKnowHow®:
DEPLOY CAPITAL
→ utilize
→ create value
→ prove value
→ capture value
→ convert value to FCF
→ allocate FCF
→ replicate winners
→ compound.
This is the strategic shift from:
ASSET MANAGEMENT
to:
FCF CAPITAL ORCHESTRATION™
18. THE ULTIMATE BOARD QUESTION
The question is not:
“How large is our installed asset base?”
It is:
“HOW MUCH VERIFIED, REPEATABLE AND COMPOUNDING FCF DOES OUR ASSET BASE PRODUCE PER EURO OF CAPITAL?”
That is the economic productivity test.
RAPIDKNOWHOW® FINAL AHA
Industrial Gas assets do not create enterprise value because they exist.
They create enterprise value when management turns them into an integrated system that repeatedly converts:
CAPITAL → CUSTOMER VALUE → CASH → FCF → MORE PRODUCTIVE CAPITAL
Therefore:
DON’T MANAGE THE ASSET.
MANAGE THE MULTIPLIER ENGINE.
ASSET UTILIZATION
→ CUSTOMER VALUE
→ VALUE PROOF
→ VALUE CAPTURE
→ CASH CONVERSION
→ REINVESTMENT QUALITY
→ COMPOUNDING FCF™
RapidKnowHow®
THE DECISION COMPANY™
ACTION CHECKLIST™
☐ Select the Top 20 Industrial Gas assets or asset systems by capital employed.
☐ Measure utilization.
☐ Define customer value delivered.
☐ Quantify and verify the economic result.
☐ Measure value captured.
☐ Calculate asset-level FCF.
☐ Calculate FCF / € capital employed.
☐ Score all six FCF multipliers.
☐ Identify the weakest multiplier.
☐ Make one SCALE / IMPROVE / REDEPLOY / EXIT decision.
☐ Measure the FCF improvement.
☐ Reinvest only into proven high-FCF configurations.
☐ Replicate the winning system across customers and clusters.
FINAL PASS / FAIL
Can management show exactly how €1 of Industrial Gas capital becomes customer value, cash, FCF and then more FCF?
YES → FCF MULTIPLIER ENGINE WORKING.
NO → FIND THE CHOKEPOINT.
RapidKnowHow® BUSINESS CASE
HOW €1 OF INDUSTRIAL GAS CAPITAL BECOMES CUSTOMER VALUE → CASH → FCF → MORE FCF™
CASE: BULK TANK + TELEMETRY + AUTOMATIC REPLENISHMENT
The purpose is to answer one board question:
WHAT HAPPENS TO €1 AFTER WE INVEST IT?
1. START WITH €100,000 OF CAPITAL
The Industrial Gas supplier invests:
| Asset | Capital |
|---|---|
| Cryogenic bulk tank | €65,000 |
| Vaporizer / installation | €20,000 |
| Telemetry / controls | €5,000 |
| Commissioning / infrastructure | €10,000 |
| TOTAL CAPITAL | €100,000 |
This €100,000 becomes the installed customer supply platform.
But installation itself creates no return.
The asset must now produce value.
2. PUT THE ASSET TO WORK
The system supplies a manufacturing customer with bulk industrial gas.
The tank + telemetry + automatic replenishment system produces:
- continuous gas availability
- fewer emergency deliveries
- larger optimized delivery drops
- lower customer inventory risk
- fewer manual ordering activities
- fewer stock-outs
- better production reliability
- lower total supply-chain cost
The physical asset becomes:
A CUSTOMER VALUE-DELIVERY SYSTEM.
3. CUSTOMER VALUE CREATED = €70,000 / YEAR
Assume the system creates the following measurable annual customer value:
| Customer Value Delivered | Annual Value |
|---|---|
| Avoided production interruptions | €30,000 |
| Lower inventory / working capital burden | €15,000 |
| Lower administration and ordering cost | €5,000 |
| Fewer emergency deliveries | €5,000 |
| Higher operational productivity | €15,000 |
| TOTAL VERIFIED CUSTOMER VALUE | €70,000 |
Therefore:
€100,000 CAPITAL → €70,000 CUSTOMER VALUE / YEAR
Normalized:
€1 CAPITAL → €0.70 CUSTOMER VALUE / YEAR
But customer value is not yet supplier cash.
That is the first critical distinction.
4. CONVERT CUSTOMER VALUE INTO SUPPLIER CASH
The supplier captures only part of the value created.
Assume the supplier captures value through:
| Value Capture | Annual Cash Effect |
|---|---|
| Equipment rental / service | €8,000 |
| Improved pricing / value premium | €7,000 |
| Additional gas volume / share of wallet | €10,000 |
| Logistics optimization | €8,000 |
| Fewer emergency/service costs | €4,000 |
| Better working-capital efficiency | €3,000 |
| TOTAL CASH CONTRIBUTION | €40,000 |
Therefore:
€70,000 CUSTOMER VALUE → €40,000 SUPPLIER CASH CONTRIBUTION
The supplier does not need to capture all customer value.
Customer and supplier can both win.
Customer keeps significant economic value.
Supplier converts a fair share into cash.
5. CASH IS NOT YET FREE CASH FLOW
The asset still consumes cash.
Assume:
| Cash Requirement | Annual Cash |
|---|---|
| Maintenance cash cost | €4,000 |
| Incremental working capital | €3,000 |
| Sustaining CAPEX | €5,000 |
| TOTAL CASH REQUIREMENT | €12,000 |
Therefore:
€40,000 Cash Contribution
− €12,000 Cash Requirement
=
€28,000 FREE CASH FLOW
The original €100,000 asset investment therefore produces:
€28,000 FCF / YEAR
or:
28% FCF PRODUCTIVITY ON CAPITAL
Normalized:
€1 CAPITAL → €0.28 FCF
6. THE COMPLETE €1 JOURNEY
Now the board can see exactly what happens.
€1.00 CAPITAL
↓
€0.70
VERIFIED CUSTOMER VALUE
↓
€0.40
SUPPLIER CASH CONTRIBUTION
↓
€0.28
FREE CASH FLOW
That alone is attractive.
But the real FCF Multiplier begins only now.
7. REINVEST THE €0.28
Assume the company does not consume the €28,000.
It reinvests it into similarly productive assets, telemetry, debottlenecking, tanks and customer installations.
If the new capital earns the same 28% FCF productivity:
€0.28 reinvested
× 28%
=
€0.0784 NEW ANNUAL FCF
Therefore the original €1 now produces in the next cycle:
Original FCF:
€0.2800
New FCF from reinvestment:
€0.0784
=
€0.3584 FCF
That is the FCF multiplier at work.
8. SECOND COMPOUNDING CYCLE
Reinvest the new €0.3584.
At the same 28% FCF productivity:
€0.3584 × 28% = €0.10035
New annual FCF:
€0.3584 + €0.10035
=
€0.45875
The original €1 of capital is now supporting almost:
€0.46 OF ANNUAL FCF
because past cash has been reinvested into additional productive capital.
9. FIVE-YEAR COMPOUNDING EXAMPLE
Assume:
- 28% annual FCF productivity
- 100% of FCF reinvested
- reinvested capital achieves the same economics
- no dilution from poor projects
| Year | Productive Capital Base | Annual FCF |
|---|---|---|
| Start | €1.000 | — |
| 1 | €1.000 | €0.280 |
| 2 | €1.280 | €0.358 |
| 3 | €1.638 | €0.459 |
| 4 | €2.097 | €0.587 |
| 5 | €2.684 | €0.752 |
By the end of Year 5:
€1.00 ORIGINAL CAPITAL
has generated approximately:
€2.44 CUMULATIVE FCF
and, if all cash remains invested, supports approximately:
€3.44 OF PRODUCTIVE CAPITAL
The original asset did not magically multiply.
The cash produced by the asset funded additional productive assets.
That distinction is crucial.
10. THE FCF MULTIPLIER ENGINE™
The economic chain is therefore:
€1 CAPITAL
↓
ASSET UTILIZATION
↓
€0.70 CUSTOMER VALUE
↓
VALUE PROOF
↓
VALUE CAPTURE
↓
€0.40 CASH CONTRIBUTION
↓
CASH CONVERSION
↓
€0.28 FCF
↓
REINVEST
↓
€0.078 NEW FCF
↓
REINVEST AGAIN
↓
MORE FCF
↓
COMPOUNDING FCF
11. WHERE THE MULTIPLIER CAN BREAK
This example only compounds if every link works.
CHOKEPOINT 1 — LOW UTILIZATION
€100,000 installed but insufficient customer consumption.
Result:
CAPITAL TRAP
CHOKEPOINT 2 — VALUE NOT PROVEN
The customer benefits but nobody quantifies it.
Result:
WEAK COMMERCIAL POWER
CHOKEPOINT 3 — VALUE NOT CAPTURED
Customer receives €70,000 of value but supplier captures almost none.
Result:
VALUE LEAKAGE
CHOKEPOINT 4 — POOR CASH CONVERSION
High accounting margin but logistics, working capital and CAPEX absorb the cash.
Result:
PROFIT WITHOUT FCF
CHOKEPOINT 5 — POOR REINVESTMENT
The €28,000 FCF is put into a low-return project.
Result:
COMPOUNDING STOPS.
12. THE MOST IMPORTANT NUMBER
The key board KPI is therefore not merely:
Revenue / Asset
or:
EBITDA / Asset
It is:
SUSTAINABLE FCF / € CAPITAL EMPLOYED
In this illustrative case:
€28,000 FCF / €100,000 Capital
=
28% FCF PRODUCTIVITY
That number determines the power of the reinvestment engine.
13. CUSTOMER + SUPPLIER SHARED VALUE
This case also demonstrates why the system can be commercially sustainable.
Customer value created:
€70,000
Supplier cash captured:
€40,000
The customer retains significant value.
The supplier receives enough economics to:
- operate reliably
- maintain the asset
- earn FCF
- reinvest
- serve more customers
Therefore:
CUSTOMER VALUE AND SUPPLIER FCF ARE NOT OPPOSITES.
The strongest system increases the total value pool first.
Then shares it intelligently.
14. FROM ONE CUSTOMER TO ONE CLUSTER
The next multiplier comes from replication.
Imagine ten similar customers in one geographic cluster.
More customers create:
MORE TANKS
↓
more gas volume
↓
greater route density
↓
larger drops
↓
lower logistics cost / tonne
↓
higher asset utilization
↓
higher FCF / customer
↓
more reinvestment capacity
↓
more customers
↓
CLUSTER FCF COMPOUNDING
The economics can therefore become stronger as the network grows.
15. THE RAPIDKNOWHOW® €1 FCF TEST™
For every significant Industrial Gas investment ask:
€1 — CAPITAL
Where exactly is the euro invested?
€0.X — CUSTOMER VALUE
What measurable value does it create?
€0.X — VALUE CAPTURE
What fair share becomes supplier economics?
€0.X — CASH
How much becomes real cash?
€0.X — FCF
How much remains after all cash requirements?
€0.X — REINVESTMENT
Where is the FCF reinvested?
€0.X — NEW FCF
How much additional annual FCF does the reinvestment create?
If management cannot answer all seven questions:
THE CAPITAL IS NOT YET BEING MANAGED AS AN FCF ENGINE.
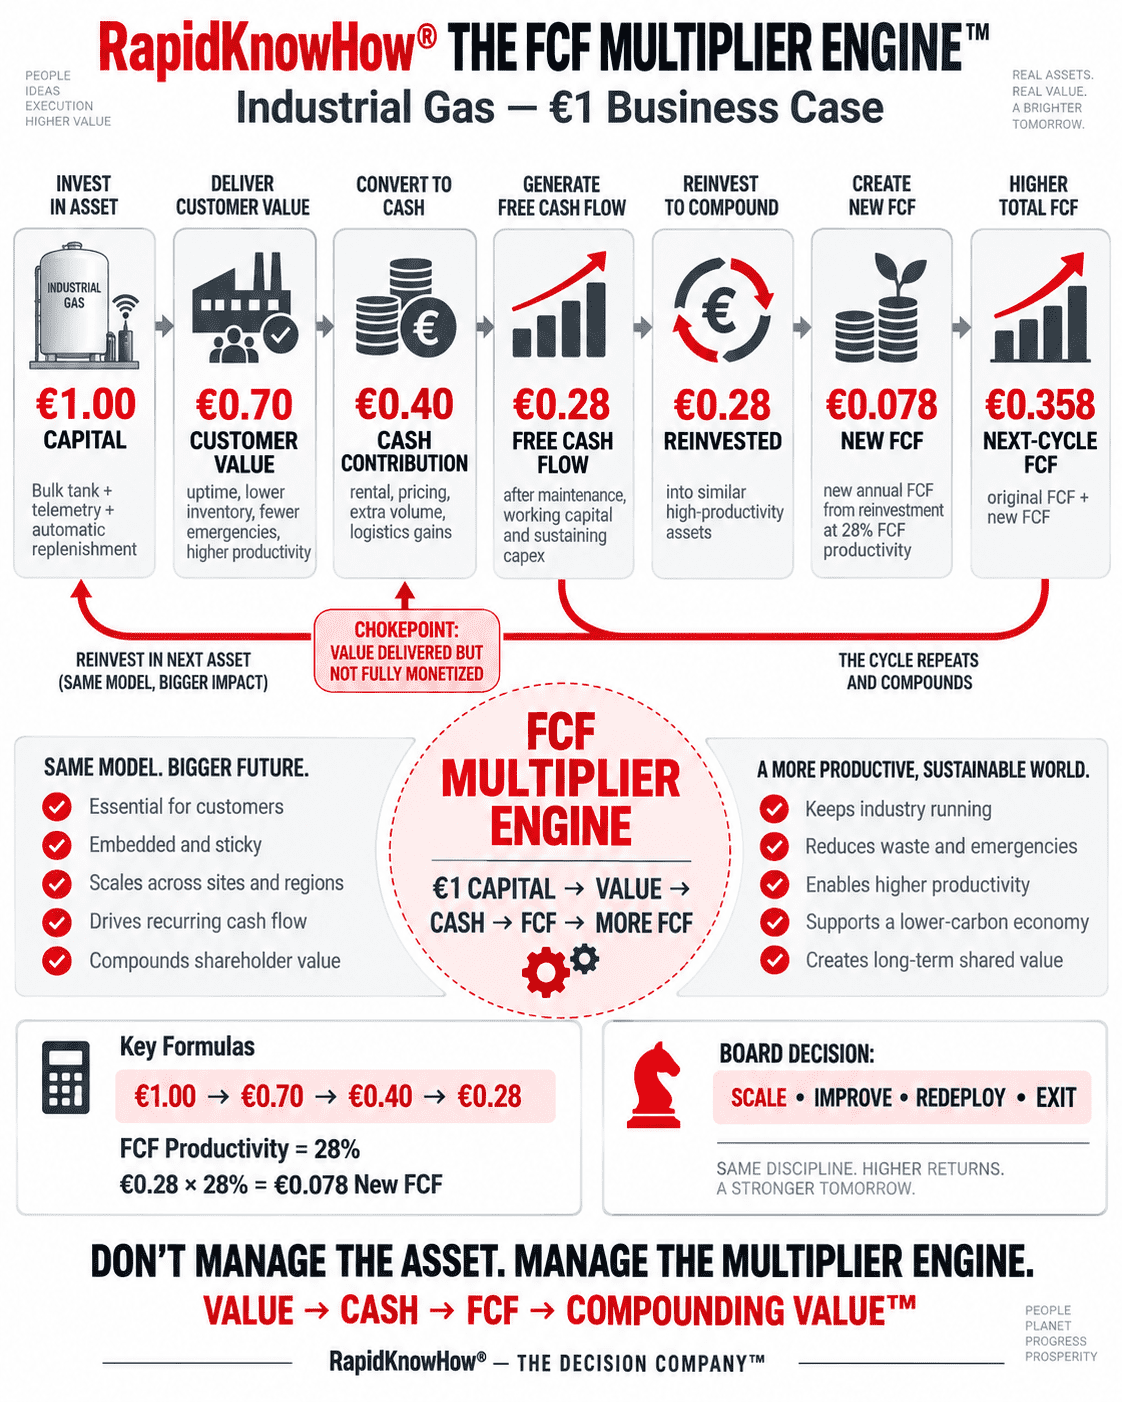
16. ONE-PICTURE BUSINESS CASE
ORIGINAL €1
€1.00 CAPITAL
→ €0.70 CUSTOMER VALUE
→ €0.40 CASH CONTRIBUTION
→ €0.28 FCF
→ €0.28 REINVESTED
→ €0.078 NEW FCF
→ €0.358 TOTAL NEXT-CYCLE FCF
→ REINVEST
→ COMPOUND
FINAL AHA
Industrial Gas capital should not be evaluated only by:
What did the asset cost?
The board should trace the complete economic chain:
€1 CAPITAL
→ CUSTOMER VALUE
→ VERIFIED VALUE
→ VALUE CAPTURE
→ CASH
→ FCF
→ REINVESTMENT
→ NEW FCF
The winning asset is not the cheapest asset.
It is the asset system that repeatedly produces:
MORE VERIFIED CUSTOMER VALUE + MORE FCF PER € OF CAPITAL
and allows that cash to be reinvested at attractive returns.
THE FCF MULTIPLIER ENGINE™
€1 → VALUE → CASH → €0.28 FCF → REINVEST → MORE FCF → COMPOUND
RapidKnowHow®
THE DECISION COMPANY™
Leave a Reply