Visual thinking is a powerful tool that can be used to solve complex problems quickly and efficiently. It involves the use of visual aids to organize thoughts, ideas, and information in a way that makes it easier to understand and analyze. This method of thinking is particularly useful in business settings, where executives often have to make quick decisions based on large amounts of data.
Visual thinking can be applied in various ways to demonstrate how to solve complex problems. For instance, mind maps can be used to break down a problem into smaller, more manageable parts. This allows for a clearer understanding of the problem and helps identify potential solutions. Similarly, flowcharts can be used to visualize the steps involved in a process or procedure, making it easier to identify bottlenecks or inefficiencies.
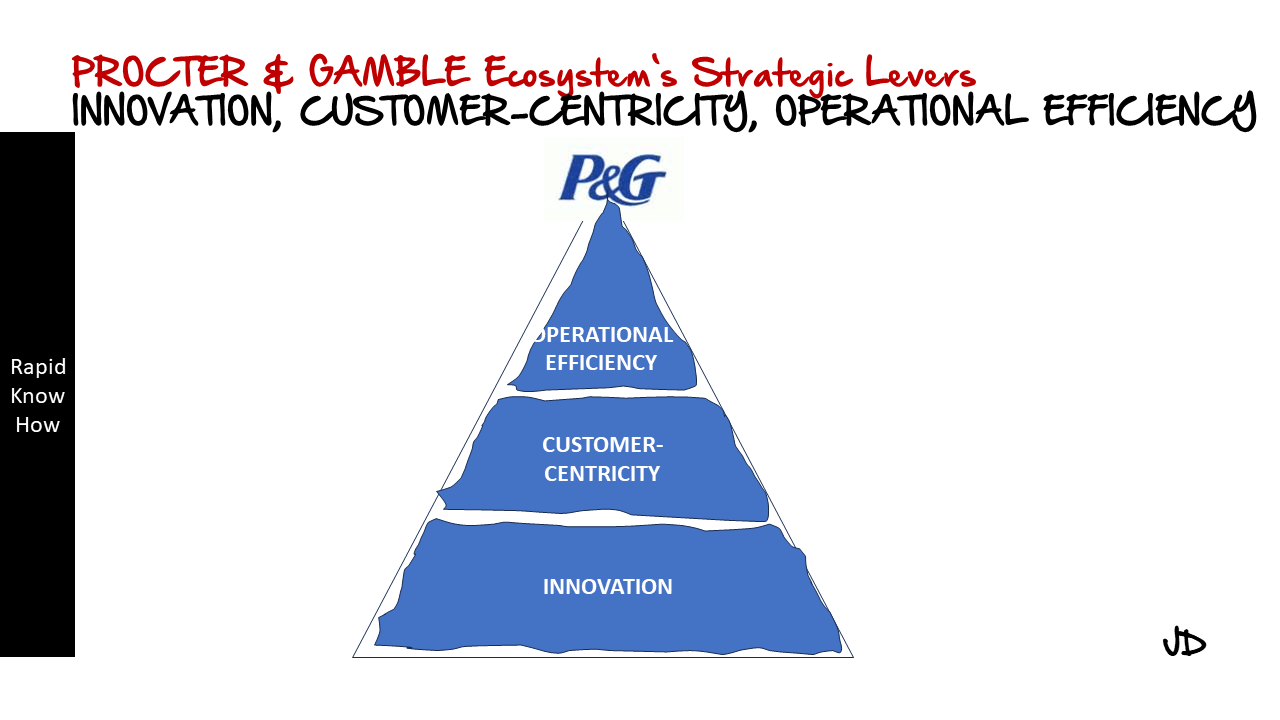
In the case of comparing competitors’ strengths and weaknesses, visual thinking can be particularly effective. Executives can use tools such as SWOT analysis diagrams or competitive analysis charts to visually represent the strengths and weaknesses of their own company versus their competitors. This not only provides a clear overview of the competitive landscape but also helps identify areas where their company can improve or capitalize on competitors’ weaknesses.
Case Study: How Executives Use Visual Thinking to Compare Competitors’ Strengths and Weaknesses
Consider the case of a large technology company looking to gain an edge over its competitors. The executive team decides to use visual thinking techniques to better understand their position in the market.
Firstly, they conduct a SWOT analysis for their own company and each of their main competitors. They create diagrams for each analysis, with strengths, weaknesses, opportunities, and threats clearly marked. These diagrams are then displayed side by side for easy comparison.
Next, they create a competitive analysis chart. This chart includes key factors such as market share, product range, innovation capability, customer service quality, brand reputation, and financial stability. Each company is rated on these factors, and the results are visually represented on the chart.
By using these visual thinking techniques, the executives are able to quickly identify their company’s strengths and weaknesses compared to their competitors. They notice that while they have a wider product range than most competitors, their brand reputation is weaker. They also identify an opportunity in the form of a competitor’s declining market share.
Based on these insights, they decide to launch a marketing campaign aimed at improving brand reputation while also targeting customers of the competitor with declining market share.
In conclusion, visual thinking is an effective tool for solving complex problems quickly. By visually representing information and ideas, executives can gain a clearer understanding of problems and make informed decisions more efficiently.