
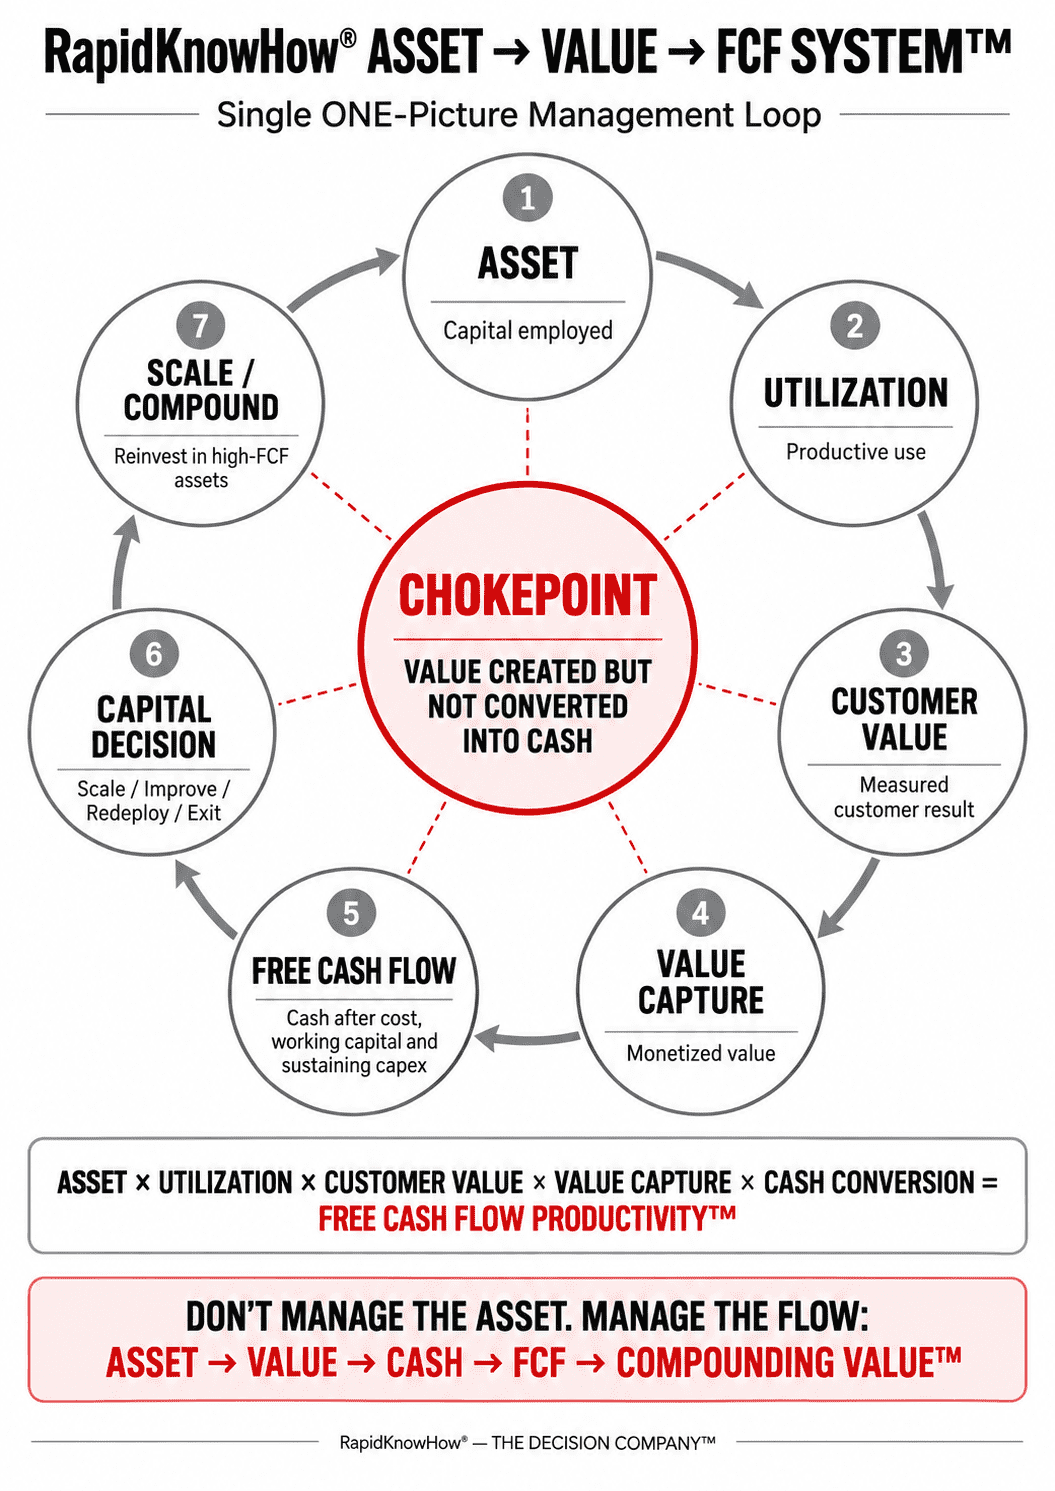
RapidKnowHow® ASSET → VALUE → FCF SYSTEM™
Power Report 2026
Below is the board-ready RapidKnowHow® ASSET → VALUE → FCF SYSTEM™ Power Report, designed to connect directly with our Industrial Gas Total FCF Operating System™.
THE MANAGEMENT SHIFT
Stop managing assets as depreciating equipment.
Start managing assets as cash-producing capital.
The traditional asset-management question is:
“How do we maintain this asset at acceptable cost?”
The RapidKnowHow® question is:
“How much verified Free Cash Flow does this asset produce — and how can we increase it?”
That changes the management system from:
ASSET → COST → DEPRECIATION
to:
ASSET → CUSTOMER VALUE → CASH → FCF → REINVEST / SCALE → ENTERPRISE VALUE
1. THE CORE SYSTEM
ASSET → VALUE → FCF™
Every productive asset must pass through six stages:
1. ASSET
Identify the capital employed.
Examples:
- Industrial gas plant
- Cryogenic tank
- Cylinder fleet
- Cryogenic container
- Trailer
- Filling equipment
- Pipeline
- Distribution vehicle
- Telemetry system
- Customer-installed equipment
The asset itself is not the economic result.
It is only the capital platform from which value can be created.
2. UTILIZATION
Determine whether the asset is actually being used productively.
Measure:
- operating hours
- fill cycles
- delivered volume
- capacity utilization
- customer utilization
- route utilization
- idle days
- turnaround time
Core question:
Is the asset working — or merely existing?
An expensive asset with low productive utilization destroys capital productivity even when it appears operationally healthy.
3. CUSTOMER VALUE
Connect the asset to a measurable customer outcome.
Typical value delivered:
- production uptime
- supply reliability
- lower handling cost
- lower inventory
- reduced emergency deliveries
- lower energy consumption
- reduced product loss
- higher productivity
- lower total cost of ownership
- improved working capital
The asset becomes strategically important only when its use produces an economic result for the customer.
ASSET USE ≠ VALUE
ASSET USE → CUSTOMER RESULT = VALUE
4. VALUE CAPTURE
Determine how much of the value created is converted into supplier economics.
Value capture can come through:
- price
- rental
- service charge
- volume growth
- contract extension
- additional applications
- higher share of wallet
- reduced service cost
- lower distribution cost
- lower capital employed
- improved retention
The key question becomes:
Are we creating value without capturing enough of it?
A business can create substantial customer value while still destroying shareholder value if the commercial model fails to capture an appropriate share.
5. FREE CASH FLOW
Translate asset economics into cash.
A simplified asset-level logic:
Revenue
– Operating Cash Cost
– Service / Logistics Cost
– Maintenance Cash Cost
– Working-Capital Requirement
– Sustaining Capital Expenditure
= Asset Free Cash Flow
The board should therefore see more than revenue and EBITDA.
It should see:
FCF PER ASSET
and
FCF PER € OF CAPITAL EMPLOYED
6. COMPOUND
Allocate capital toward the assets and configurations producing the strongest sustainable cash returns.
HIGH-FCF ASSET
→ replicate
→ expand utilization
→ increase applications
→ extend customer footprint
→ standardize model
→ scale across clusters
LOW-FCF ASSET
→ improve utilization
→ reprice
→ redesign service
→ redeploy
→ sell
→ retire
Capital is continuously moved toward its most productive use.
2. THE RAPIDKNOWHOW® ASSET VALUE CHAIN
ONE SIMPLE FLOW
CAPITAL ASSET
↓
PRODUCTIVE UTILIZATION
↓
CUSTOMER VALUE
↓
VALUE CAPTURE
↓
VERIFIED CASH
↓
FREE CASH FLOW
↓
REINVEST / REDEPLOY / SCALE
↓
COMPOUNDING ENTERPRISE VALUE
This is the central management loop.
3. THE CRITICAL MANAGEMENT CHANGE
Traditional asset management often optimizes:
Availability + Maintenance + Cost
The RapidKnowHow® system optimizes:
UTILIZATION + CUSTOMER VALUE + VALUE CAPTURE + FCF
The difference is fundamental.
A technically perfect asset can still be economically weak.
A fully depreciated asset can still be extremely valuable.
A new asset can destroy cash.
An older asset can compound cash.
Therefore:
BOOK VALUE IS NOT ECONOMIC VALUE.
The decisive measure is:
VERIFIED FUTURE CASH GENERATION.
4. THE FIVE ASSET QUESTIONS
Every major asset should answer five questions.
1. Is it productive?
UTILIZATION
How much of its available productive capacity is actually being used?
2. Is it creating customer value?
VALUE CREATED
What measurable economic problem does it solve?
3. Are we capturing value?
VALUE CAPTURE
What proportion of the economic value becomes supplier cash?
4. Is it producing FCF?
CASH PRODUCTIVITY
How much sustainable FCF does the asset generate?
5. Should we invest more capital?
CAPITAL DECISION
Scale, improve, redeploy, harvest or exit?
5. THE ASSET FCF SCORECARD™
For every material asset or asset family, management should track:
| Measure | Management Question |
|---|---|
| Asset Capital | How much capital is tied up? |
| Utilization % | How intensively is it used? |
| Revenue / Asset | How much revenue does it enable? |
| Customer Value | What measurable customer outcome is created? |
| Value Capture % | How much value do we monetize? |
| Operating Cash Cost | What cash is consumed? |
| Working Capital | How much additional cash is tied up? |
| Sustaining CAPEX | What cash must be reinvested? |
| FCF / Asset | What cash remains? |
| FCF / Capital | How productive is our capital? |
| Future FCF Potential | Can the asset produce more? |
| Decision | SCALE / IMPROVE / REDEPLOY / EXIT |
The dashboard should force one decision.
Not merely show numbers.
6. THE FOUR ASSET DECISIONS™
Every asset ultimately belongs in one of four categories.
1. SCALE
High utilization
- strong customer value
- strong FCF
- attractive reinvestment economics.
Decision: Put more capital behind the model.
2. IMPROVE
Strong market need
but weak utilization, pricing or operating productivity.
Decision: Remove the economic chokepoint.
3. REDEPLOY
Asset is viable but deployed in the wrong customer, site, route or market.
Decision: Move capital toward higher-value use.
4. EXIT
Low customer value
- structurally weak utilization
- weak FCF outlook.
Decision: Stop trapping capital.
7. INDUSTRIAL GAS EXAMPLE
Consider a cryogenic tank installed at a customer.
Traditional management may measure:
Tank Installed
→ Technical Availability
→ Maintenance
→ Depreciation
RapidKnowHow® measures:
Tank
↓
Customer Consumption
↓
Tank Turnover / Refill Frequency
↓
Distribution Efficiency
↓
Customer Production Reliability
↓
Customer TCO Improvement
↓
Supplier Margin + Retention + Volume
↓
Tank-Level FCF
↓
FCF / Capital Employed
↓
SCALE / OPTIMIZE / REDEPLOY
The tank becomes a cash-producing capital asset, not simply installed equipment.
8. CRYO CONTAINER EXAMPLE
A cryogenic container should not be managed simply as:
Purchase → Rent → Maintain → Depreciate
Instead:
CRYO CONTAINER
→ utilization days
→ trips / cycles
→ delivered product
→ customer applications
→ revenue generated
→ logistics avoided
→ service cost
→ maintenance cash
→ capital tied up
→ FCF generated
→ FCF / container
→ FCF / € invested
Management can then compare individual containers, fleets, customer groups and geographic clusters.
This exposes three things quickly:
CASH PRODUCERS
CASH TRAPS
UNUSED FCF POTENTIAL
9. THE CHOKEPOINT
The biggest failure in conventional asset management is usually not the physical asset.
It is the missing connection between:
ASSET
and
ECONOMIC VALUE.
Departments see different fragments:
Engineering sees equipment.
Operations sees reliability.
Sales sees customers.
Finance sees depreciation and ROCE.
Management sees CAPEX.
But nobody owns the entire:
ASSET → VALUE → CASH → FCF LOOP.
RapidKnowHow® connects those fragments into one management system.
10. THE BOARD DECISION PICTURE
The board should be able to look at one page and see:
TOP LEFT — CAPITAL
Where is the money invested?
TOP RIGHT — VALUE
Where is measurable customer value being created?
BOTTOM LEFT — CASH
Where is value actually being monetized?
BOTTOM RIGHT — FCF
Which assets create or destroy cash?
At the center:
ONE CAPITAL ALLOCATION DECISION
SCALE
IMPROVE
REDEPLOY
EXIT
11. THE COMPOUNDING FCF ENGINE™
Once implemented across the asset portfolio:
BETTER ASSET VISIBILITY
↓
BETTER UTILIZATION
↓
MORE CUSTOMER VALUE
↓
BETTER VALUE CAPTURE
↓
HIGHER FCF
↓
BETTER CAPITAL ALLOCATION
↓
MORE HIGH-FCF ASSETS
↓
HIGHER FCF AGAIN
↓
COMPOUNDING ENTERPRISE VALUE
This is the economic flywheel.
12. THE RAPIDKNOWHOW® MANAGEMENT RULE
NEVER ASK ONLY:
“What does this asset cost?”
Ask:
What value does it create?
What cash does it capture?
How much FCF does it produce?
What is the next capital decision?
13. ONE DECISION SYSTEM™
For every significant asset or asset class:
ONE SIGNAL
Asset FCF performance is above or below required level.
ONE DECISION
Scale / Improve / Redeploy / Exit.
WHY NOW
Capital remains scarce and every idle or low-productivity asset carries an opportunity cost.
TOP 3 ACTIONS
- Measure asset-level utilization and cash economics.
- Connect asset use to measurable customer value.
- Reallocate capital toward highest sustainable FCF.
30-DAY RESULT
First Asset → Value → FCF Dashboard™ operational for the selected asset portfolio.
CONFIDENCE
Verified by Operations + Commercial + Finance data.
14. BOARD-LEVEL VALUE PROPOSITION
RapidKnowHow® helps management convert:
STATIC ASSET REGISTER
into
DYNAMIC CASH-PRODUCTIVITY SYSTEM.
The outcome is not better asset documentation.
The outcome is:
MORE CASH FROM EXISTING CAPITAL.
15. RAPIDKNOWHOW® ASSET → VALUE → FCF MASTER FORMULA™
ASSET × UTILIZATION × CUSTOMER VALUE × VALUE CAPTURE × CASH CONVERSION
= FREE CASH FLOW PRODUCTIVITY™
The weakest factor becomes the strategic chokepoint.
Find it.
Fix it.
Measure the cash result.
Scale what works.
ACTION CHECKLIST™
SETUP
☐ Select one important asset class.
☐ Determine capital employed.
☐ Define asset owner.
CORE SYSTEM
☐ Measure productive utilization.
☐ Link utilization to customer value.
☐ Quantify value capture.
VALUE / RESULT
☐ Calculate asset-level FCF.
☐ Calculate FCF / € capital employed.
☐ Verify with Finance.
CUSTOMER JOURNEY
☐ Identify the customer outcome produced by the asset.
☐ Confirm whether that value is measurable.
OPERATING CHECK
☐ Identify idle capacity.
☐ Identify avoidable operating and logistics costs.
COMMERCIAL CHECK
☐ Check pricing and value capture.
☐ Identify expansion opportunities.
KPI CHECK
☐ Utilization.
☐ Customer Value.
☐ Value Capture.
☐ FCF / Asset.
☐ FCF / Capital.
CAPITAL CHECK
☐ SCALE.
☐ IMPROVE.
☐ REDEPLOY.
☐ EXIT.
FINAL PASS / FAIL
Can management show how this asset turns invested capital into verified Free Cash Flow?
YES → Manage and compound it.
NO → The asset is not yet being managed economically.
RAPIDKNOWHOW® FINAL AHA
DON’T MANAGE THE ASSET.
MANAGE THE FLOW:
ASSET → VALUE → CASH → FCF → COMPOUNDING VALUE™
TURN CAPITAL ASSETS INTO CASH-PRODUCING CAPITAL.
RapidKnowHow®
THE DECISION COMPANY™
Leave a Reply