
Power Report 2026
THE CORE IDEA
Industrial gas assets should not be managed primarily as depreciating equipment.
They should be managed as:
VALUE-DELIVERY ASSETS THAT PRODUCE RECURRING FREE CASH FLOW.
The operating logic becomes:
ASSET → VALUE DELIVERY → VALUE CAPTURE → FCF → REINVEST → COMPOUND
1. START WITH THE INDUSTRIAL GAS ASSET
Typical cash-producing capital assets include:
- Air Separation Units
- CO₂ plants
- hydrogen plants
- filling plants
- bulk storage tanks
- cryogenic tanks
- cylinder fleets
- cryogenic containers
- trailers
- vaporizers
- pipelines
- telemetry systems
- automatic replenishment systems
- customer-installed equipment
- distribution infrastructure
The question is not:
“What is the asset worth on the balance sheet?”
The decisive question is:
“What recurring customer value and FCF does this asset enable?”
2. PUT THE ASSET INTO PRODUCTIVE USE
An industrial gas asset creates no economic value simply by existing.
Measure:
CAPACITY
→ utilization
→ throughput
→ turns
→ deliveries
→ customer usage
→ operating hours
→ route density
Examples:
Cryogenic tank: tonnes delivered / tank / year
Cylinder fleet: turns / cylinder / year
Container: productive days / available days
ASU: utilized output / available production capacity
The first economic chokepoint is therefore:
IDLE CAPITAL.
3. TURN ASSET USE INTO CUSTOMER VALUE DELIVERY
This is the critical bridge.
Industrial gas customers rarely buy the physical gas alone.
They buy an operational result.
Examples:
GAS + ASSET + SERVICE
→ continuous production
→ stable process
→ reliable supply
→ safer operation
→ reduced labor
→ lower inventory
→ lower energy use
→ fewer emergency deliveries
→ lower product losses
→ higher productivity
→ lower Total Cost of Ownership
Therefore:
THE REAL PRODUCT IS THE VERIFIED CUSTOMER RESULT.
4. VERIFY THE VALUE DELIVERED
Customer value must become measurable.
Typical value indicators:
RELIABILITY
Avoided production interruption.
PRODUCTIVITY
More output per hour.
TCO
Lower total operating cost.
ENERGY
Reduced energy consumption.
LOGISTICS
Fewer deliveries and emergency trips.
INVENTORY
Lower customer inventory.
LABOR
Reduced handling and administration.
QUALITY
Reduced scrap or process variation.
WORKING CAPITAL
Less cash tied up.
RESILIENCE
Higher security of supply.
This converts:
“We supply industrial gases.”
into:
“We deliver measurable economic outcomes.”
5. CAPTURE A FAIR SHARE OF THE VALUE
Value creation alone does not produce FCF.
The supplier must convert value delivered into economic value captured.
Mechanisms include:
- volume growth
- premium pricing
- equipment rental
- service fees
- automatic replenishment
- application services
- contract extensions
- multi-site expansion
- increased share of wallet
- productivity sharing
- verified-value agreements
The commercial question becomes:
HOW MUCH OF THE VERIFIED CUSTOMER VALUE FLOWS BACK TO THE SUPPLIER?
6. CONVERT VALUE CAPTURE INTO CASH
The next step is cash conversion.
Industrial Gas Cash Flow Logic
Customer Revenue
− gas production cash cost
− distribution cash cost
− service cost
− asset operating cost
− maintenance cash cost
− working capital
− sustaining CAPEX
=
FREE CASH FLOW
This should increasingly be measurable at:
Customer level
Asset level
Route level
Cluster level
Business-model level
7. IDENTIFY THE FCF ENGINE
The strongest industrial gas economics emerge when one asset produces repeated value over a long period.
Example:
BULK TANK FCF ENGINE™
Tank installed
→ automatic replenishment
→ predictable consumption
→ optimized delivery route
→ high customer switching cost
→ recurring gas volume
→ recurring cash contribution
→ contract renewal
→ application expansion
→ more customer value
→ more FCF
The asset is therefore not simply equipment.
It is:
A RECURRING CASH-FLOW PLATFORM.
8. COMPOUND THE FREE CASH FLOW
The decisive management question after producing FCF is:
Where should the cash go next?
Deploy the cash toward:
- higher-utilization assets
- profitable customer applications
- strong geographic clusters
- automatic replenishment
- high-density logistics
- multi-site customers
- digital asset control
- proven TCO solutions
- capacity debottlenecking
- high-value growth applications
This produces the loop:
FCF → BETTER ASSETS → MORE VALUE → MORE FCF
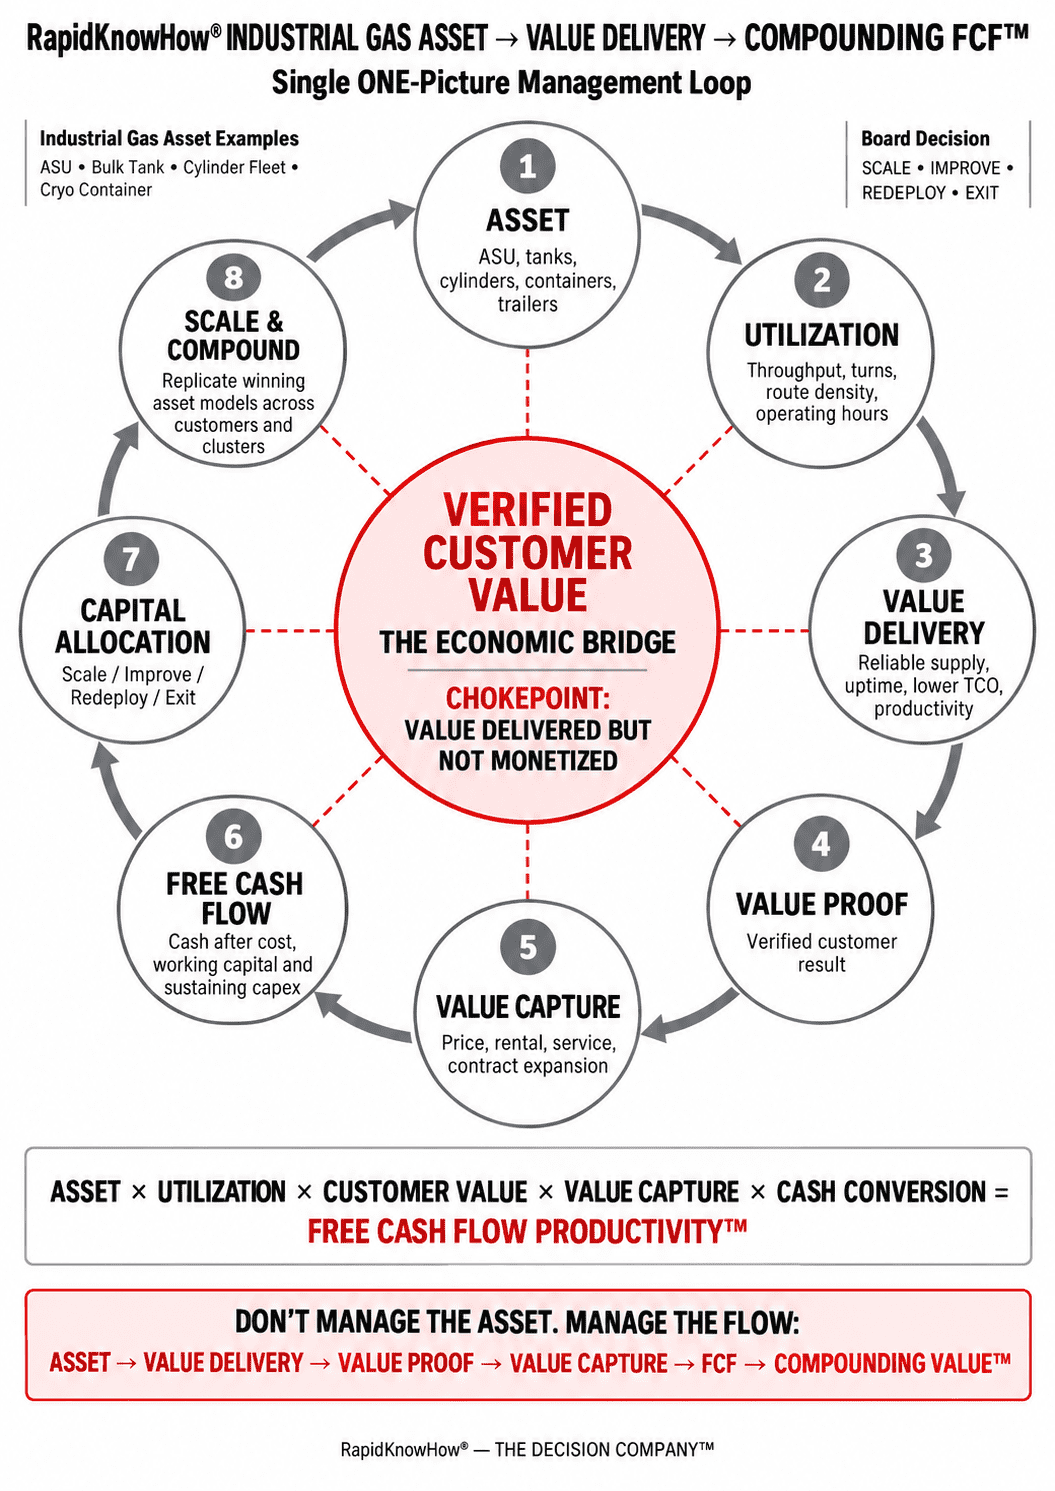
9. THE INDUSTRIAL GAS COMPOUNDING LOOP™
1 — ASSET
Capital employed.
↓
2 — UTILIZATION
Put the asset into productive use.
↓
3 — VALUE DELIVERY
Create measurable customer outcomes.
↓
4 — VALUE PROOF
Verify the economic result.
↓
5 — VALUE CAPTURE
Monetize a fair share.
↓
6 — FREE CASH FLOW
Convert captured value into cash.
↓
7 — CAPITAL ALLOCATION
Move cash toward highest-return opportunities.
↓
8 — SCALE
Replicate across customers, applications and clusters.
↓
9 — COMPOUNDING FCF
Then repeat.
10. THE INDUSTRIAL GAS CHOKEPOINT™
The largest strategic leak is often between:
VALUE DELIVERY → VALUE CAPTURE
The supplier may deliver:
high reliability
- strong logistics
- installed equipment
- engineering support
- inventory security
- process productivity
but price largely around:
€/Nm³
or
€/kg
The customer captures much of the economic benefit.
The supplier carries much of the asset investment.
That creates the central challenge:
VALUE DELIVERED BUT NOT MONETIZED.
11. THE MANAGEMENT SHIFT
OLD INDUSTRIAL GAS MODEL
Produce Gas
→ Deliver Gas
→ Maintain Assets
→ Sell Volume
→ Manage Margin
RAPIDKNOWHOW® MODEL
Deploy Capital
→ Create Customer Value
→ Verify Value
→ Capture Value
→ Convert to FCF
→ Reallocate Capital
→ Scale Proven Engines
→ Compound FCF
12. MANAGE THE PORTFOLIO BY FCF PRODUCTIVITY
Every important asset should be classified into one of four actions:
SCALE
High value + high FCF.
Invest more.
IMPROVE
Strong value but weak economics.
Fix utilization, cost or value capture.
REDEPLOY
Good asset, wrong customer/application/location.
Move the asset.
EXIT
Structurally weak value and cash productivity.
Release the capital.
13. INDUSTRIAL GAS FCF CONTROL TOWER™
Management should see one integrated picture:
| CAPITAL | VALUE | CASH |
|---|---|---|
| Asset | Customer Outcome | FCF |
| Utilization | TCO Improvement | FCF / Asset |
| Capital Employed | Productivity | FCF / Customer |
| Asset Turns | Reliability | FCF / Route |
| Capacity | Supply Security | FCF / Cluster |
Then force:
ONE CAPITAL DECISION
SCALE / IMPROVE / REDEPLOY / EXIT
14. EXAMPLE — CRYOGENIC TANK
ASSET
€120,000 installed tank system.
UTILIZATION
Customer demand increases tank turns.
VALUE DELIVERY
Automatic replenishment reduces:
- customer administration
- emergency deliveries
- stock-out risk
- operational disruption
VALUE PROOF
Customer TCO improvement quantified.
VALUE CAPTURE
Supplier captures value through:
- gas volume
- rental
- service
- contract duration
- expansion
FCF
Recurring contract cash less operating and sustaining capital requirements.
COMPOUND
Replicate the proven configuration across similar customers.
One tank becomes:
A REPEATABLE FCF BUSINESS MODEL.
15. THE STRATEGIC FORMULA
INDUSTRIAL GAS FCF PRODUCTIVITY™
ASSET
× UTILIZATION
× CUSTOMER VALUE
× VALUE CAPTURE
× CASH CONVERSION
=
FREE CASH FLOW PRODUCTIVITY
Then:
FCF
× REINVESTMENT QUALITY
× REPEATABILITY
=
COMPOUNDING FCF
16. THE BOARD QUESTION
Do not ask:
“How many tanks, cylinders, plants and containers do we own?”
Ask:
“WHICH ASSETS PRODUCE THE MOST VERIFIED CUSTOMER VALUE AND SUSTAINABLE FCF PER EURO OF CAPITAL?”
That is the capital allocation question.
RAPIDKNOWHOW® FINAL AHA
INDUSTRIAL GAS IS NOT FUNDAMENTALLY AN ASSET BUSINESS.
It is a:
VALUE-DELIVERY → CASH-CONVERSION → FCF-COMPOUNDING BUSINESS.
The physical asset is the platform.
Customer value is the economic engine.
Free Cash Flow is the result.
Capital allocation creates the compounding effect.
ASSET → VALUE DELIVERY → VALUE PROOF → VALUE CAPTURE → FCF → SCALE → COMPOUND
TURN INDUSTRIAL GAS ASSETS INTO COMPOUNDING FREE-CASH-FLOW ENGINES™
RapidKnowHow®
THE DECISION COMPANY™
ACTION CHECKLIST™
☐ Select the Top 20 industrial gas assets by capital employed.
☐ Measure utilization for each asset.
☐ Define the measurable customer value delivered.
☐ Quantify and verify that value.
☐ Calculate value captured by the supplier.
☐ Calculate asset-level FCF.
☐ Rank assets by FCF / capital employed.
☐ Identify the primary chokepoint.
☐ Decide SCALE / IMPROVE / REDEPLOY / EXIT.
☐ Reinvest FCF only into proven high-productivity configurations.
☐ Replicate winning configurations across customers and clusters.
PASS / FAIL TEST
Can management trace €1 of invested capital from INDUSTRIAL GAS ASSET → CUSTOMER VALUE → CASH → FCF → REINVESTMENT → MORE FCF?
YES = COMPOUNDING CAPITAL ASSET.
NO = UNMANAGED ECONOMIC POTENTIAL.
The strongest ONE-picture version is now a 7-stage clockwise loop:
INDUSTRIAL GAS ASSET → UTILIZATION → VALUE DELIVERY → VALUE CAPTURE → FREE CASH FLOW → REINVEST → SCALE & COMPOUND, with VERIFIED CUSTOMER VALUE in the center as the controlling bridge.
Leave a Reply