Answer:
Demonstrating strategic levers through simple illustrations is an effective way to communicate complex ideas and strategies. It helps in breaking down the complexity, making it easier for everyone to understand. Here’s how you can do it:
**Idea Illustration**
Idea illustration is a powerful tool that can help you visually represent your strategic levers. Here are three examples:
1. **Flowcharts**: Flowcharts are a great way to illustrate processes or workflows. For instance, if your strategic lever is improving operational efficiency, you can create a flowchart that shows the current process and another one that shows the improved process.
2. **Infographics**: Infographics can be used to represent data or information in a visually appealing way. If your strategic lever is increasing market share, you can create an infographic that shows your current market share versus your competitors and another one that shows your target market share.
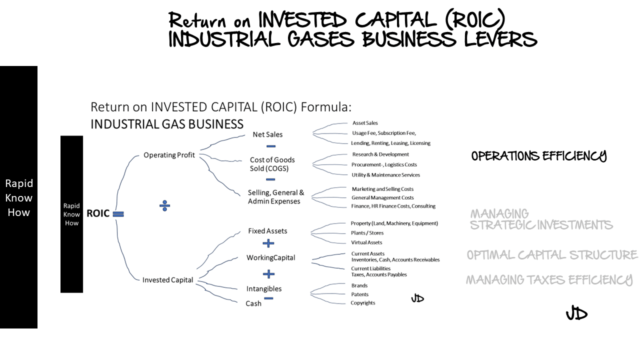
3. **Mind Maps**: Mind maps are useful for illustrating relationships between different elements. If your strategic lever is diversifying product offerings, you can create a mind map that shows how different products are related to each other and how they contribute to your overall business strategy.
**Idea Exploration**
Idea exploration involves investigating different possibilities and scenarios. Here are three examples:
1. **Scenario Planning**: Scenario planning involves creating different scenarios based on various factors and variables. For example, if your strategic lever is expanding into new markets, you can create different scenarios based on factors like market size, competition, regulatory environment, etc.
2. **SWOT Analysis**: SWOT analysis involves identifying strengths, weaknesses, opportunities, and threats related to a particular strategy or decision. If your strategic lever is launching a new product, you can conduct a SWOT analysis to explore different aspects of this decision.
3. **Decision Trees**: Decision trees are useful for exploring different outcomes based on various decisions or actions. If your strategic lever is investing in new technology, you can create a decision tree that shows different outcomes based on factors like cost, implementation time, expected benefits, etc.
**Visual Discovery**
Visual discovery involves using visuals to uncover insights or patterns. Here are three examples:
1. **Data Visualization**: Data visualization involves using graphical representations of data to uncover insights or patterns. For example, if your strategic lever is improving customer satisfaction, you can use data visualization to analyze customer feedback and identify areas for improvement.
2. **Heat Maps**: Heat maps are useful for identifying patterns or trends in large datasets. If your strategic lever is optimizing website performance, you can use a heat map to identify areas of your website where users spend the most time.
3. **Network Diagrams**: Network diagrams are useful for visualizing relationships between different elements. If your strategic lever is building strategic partnerships, you can use a network diagram to visualize your current and potential partners and their relationships with each other.
In conclusion, simple illustrations can be a powerful tool for demonstrating your strategic levers. They can help you communicate complex ideas and strategies in a way that is easy for everyone to understand.


