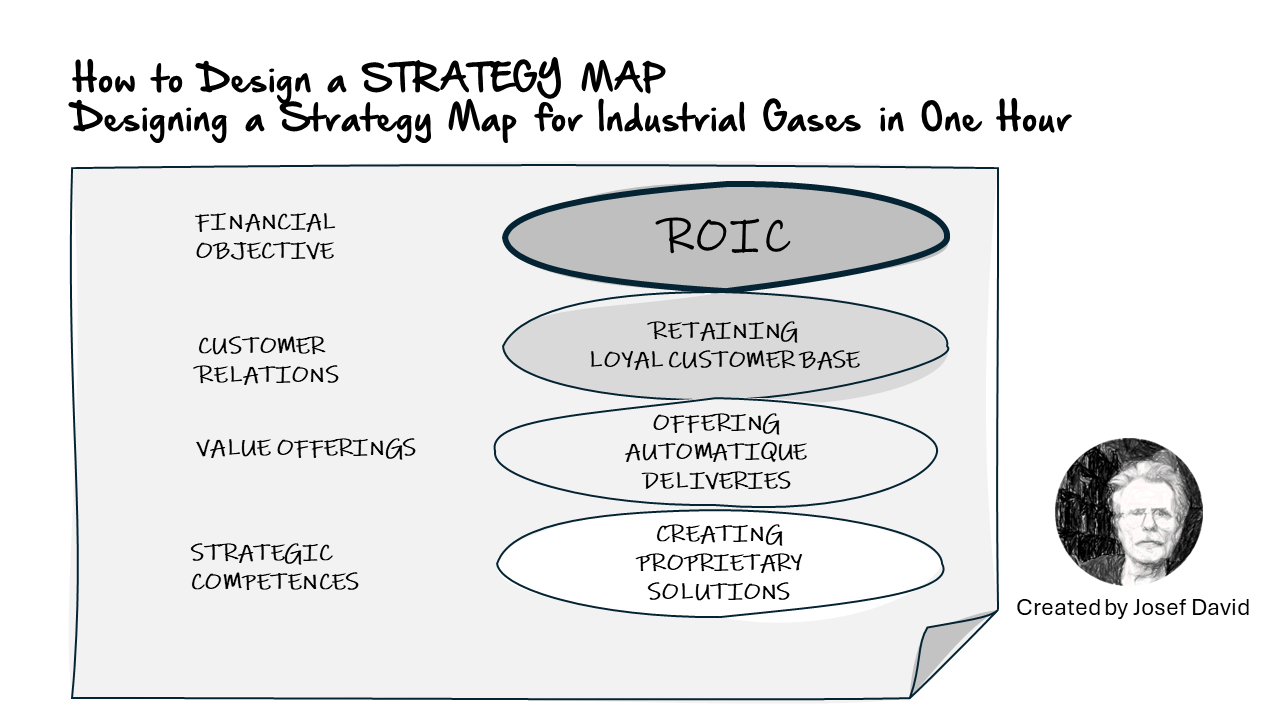
A Strategy Map is a visual representation of an organisation’s strategy, which is designed to enable a clear understanding of the strategic objectives and their causal relationships. It is a tool that provides a coherent and comprehensive view of the organisation’s strategic goals, and how they connect to each other. The concept was introduced by Robert Kaplan and David Norton in the early 2000s as part of the Balanced Scorecard methodology.
The primary components of a Strategy Map are four perspectives: Financial, Customer, Internal Process, and Learning & Growth. Each perspective contains strategic objectives that are linked in cause-and-effect relationships.
1. Financial Perspective: This includes objectives related to financial performance such as revenue growth, cost reduction, or profitability.
2. Customer Perspective: This includes objectives related to customer satisfaction, market share, or customer retention.
3. Internal Process Perspective: This includes objectives related to the efficiency and effectiveness of business processes.
4. Learning & Growth Perspective: This includes objectives related to employee skills, culture, or information systems.
Now let’s delve into how you can design a Strategy Map for an Industrial Gases company in just one hour.
Step 1: Define your Strategic Objectives
Start by defining your strategic objectives for each of the four perspectives. For an Industrial Gases company, financial objectives might include increasing profitability or reducing costs; customer objectives might include improving customer satisfaction or increasing market share; internal process objectives might include improving production efficiency or reducing waste; learning & growth objectives might include enhancing employee skills or improving information systems.
Step 2: Draw your Strategy Map
Draw a large rectangle on a piece of paper or on a whiteboard. Divide it into four horizontal sections – one for each perspective. Write your strategic objectives in each section. Start with the financial perspective at the top and end with learning & growth at the bottom.
Step 3: Connect your Strategic Objectives
Draw arrows between your strategic objectives to show the cause-and-effect relationships. For example, improving production efficiency (an internal process objective) might lead to reduced costs (a financial objective), and enhancing employee skills (a learning & growth objective) might lead to improved customer satisfaction (a customer objective).
Step 4: Review and Refine your Strategy Map
Review your Strategy Map to ensure that it provides a coherent and comprehensive view of your strategic goals. Make sure that all your strategic objectives are connected in cause-and-effect relationships. Refine your Strategy Map as necessary.
In conclusion, a Strategy Map is a powerful tool for visualising and communicating an organisation’s strategy. It provides a clear understanding of the strategic objectives and their causal relationships. Designing a Strategy Map for an Industrial Gases company, or any other organisation, can be done in just one hour by defining the strategic objectives, drawing the Strategy Map, connecting the strategic objectives, and reviewing and refining the Strategy Map. Remember, the key to a successful Strategy Map is to ensure that it provides a coherent and comprehensive view of your strategic goals.
