
Objective: Manage Assets as Cash-Producing Capital Assets – Josef David
A cryogenic-container FCF system has a different economic engine from a normal bulk-gas business: the container is both transport equipment and capital employed. Cryogenic ISO containers can move liquid gases by road, rail, and sea; commercial fleets cover products including LIN, LOX, LAr and CO₂, and holding times/payloads vary materially by gas and equipment. (Air Liquide Maritime)
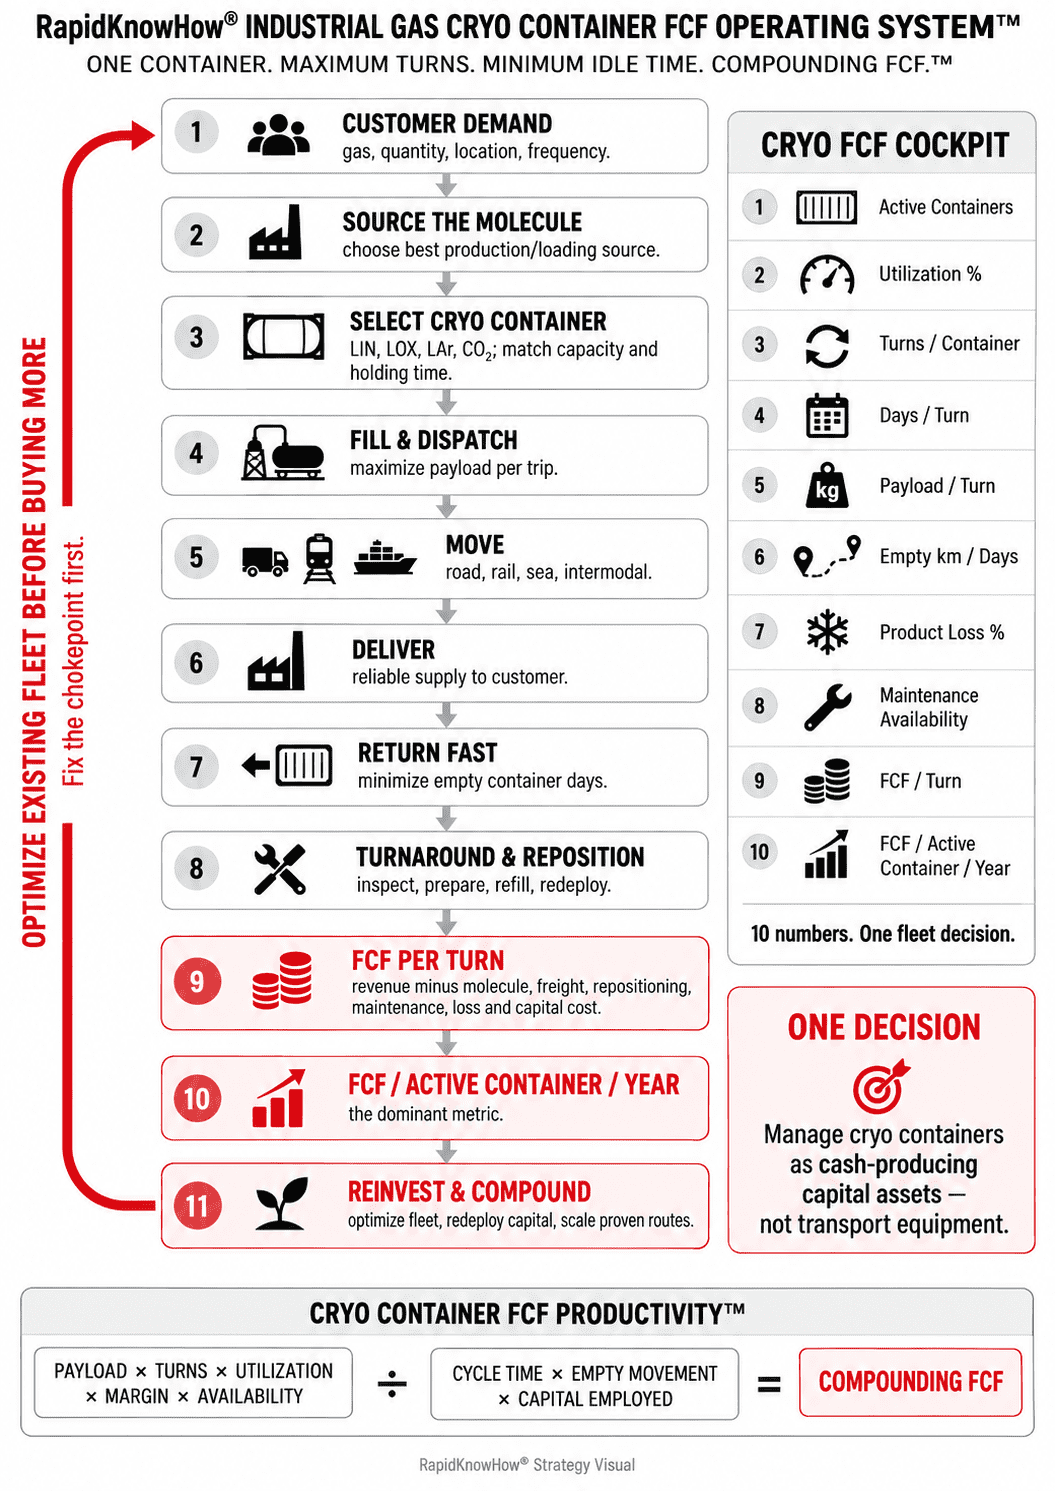
INDUSTRIAL GAS CRYO CONTAINER FCF OPERATING SYSTEM™
ONE CONTAINER. MAXIMUM TURNS. MINIMUM IDLE TIME. COMPOUNDING FCF.™
OBJECTIVE
Transform the cryogenic-container business from:
CONTAINER → TRANSPORT → DELIVERY
into:
MOLECULE → CUSTOMER → CONTAINER → TURN → CASH → REDEPLOY → COMPOUND™
The central economic question:
How much verified FCF does each active cryogenic container generate over its economic life?
THE MASTER FLOW™
1. CUSTOMER DEMAND
Identify:
Gas
Quantity
Location
Delivery frequency
Required supply security
Contract duration
↓
2. SOURCE THE MOLECULE
Select the best:
Production source
Liquid availability
Purchase cost
Loading location
↓
3. SELECT CRYO CONTAINER
Match:
LIN
LOX
LAr
LCO₂
LH₂ / other qualified products
with:
Capacity
Pressure
Insulation
Holding time
Transport requirements
↓
4. FILL
Maximize:
PAYLOAD PER TRIP™
without compromising safety, product requirements or regulatory limits.
↓
5. MOVE
Optimize:
ROAD • RAIL • SEA • INTERMODAL
↓
6. DELIVER / STORE
Customer receives reliable cryogenic supply.
↓
7. RETURN
Minimize:
EMPTY CONTAINER DAYS™
↓
8. TURNAROUND
Inspect → Prepare → Reposition → Refill
↓
9. REDEPLOY
Move the container immediately toward the strongest next FCF opportunity.
↓
10. REPEAT + COMPOUND
THE CRYO CONTAINER FCF FORMULA™
REVENUE PER TURN
minus
Molecule Cost
Loading Cost
Freight
Depot Cost
Repositioning
Handling
Maintenance
Inspection
Insurance
Loss / Boil-Off
Working Capital
Allocated Container Capital Cost
=
FCF PER CONTAINER TURN™
Then:
FCF / TURN × TURNS / YEAR = ANNUAL CONTAINER FCF™
And:
ANNUAL CONTAINER FCF ÷ CONTAINER CAPITAL EMPLOYED = CONTAINER ROCE™
THE 7 CRYO FCF ENGINES™
ENGINE 1 — CUSTOMER CONTRACT FCF ENGINE™
Do not accept business merely because a customer needs gas.
Score each contract for:
Volume
Margin
Duration
Delivery frequency
Distance
Container cycle time
Repositioning requirement
Credit quality
Growth potential
Network synergy
MASTER QUESTION
Does this customer improve the productivity of the container fleet?
ENGINE 2 — CONTAINER UTILIZATION ENGINE™
The container creates value when it is:
FILLED
MOVING PRODUCTIVELY
DELIVERING
AVAILABLE FOR THE NEXT TURN
It destroys value when it is:
WAITING
EMPTY
MISPOSITIONED
UNDER REPAIR
UNAVAILABLE
Critical KPI
PRODUCTIVE DAYS ÷ TOTAL DAYS™
Target:
MAXIMUM PRODUCTIVE DAYS
and
MINIMUM IDLE DAYS
ENGINE 3 — TURNAROUND ENGINE™
The strategic choke point is often not freight price.
It is:
TIME.
Measure the complete cycle:
AVAILABLE
→ Fill
→ Terminal dwell
→ Transport
→ Port / rail dwell
→ Customer dwell
→ Empty return
→ Inspection
→ Reposition
→ Available again
KPI
DAYS PER FULL TURN™
Every unnecessary day reduces annual container turns and therefore FCF.
ENGINE 4 — PAYLOAD + LOSS ENGINE™
A cryogenic container carries economic value only when usable product reaches the customer.
Manage:
Fill level
Payload
Holding time
Pressure
Heat ingress
Product loss
Residual product
Transfer efficiency
Commercial cryogenic-container specifications illustrate why this matters: allowable payload and reference holding periods differ by product and tank configuration. (Air Liquide Maritime)
MASTER KPI
SALEABLE PRODUCT DELIVERED ÷ PRODUCT LOADED™
Reduce avoidable molecule loss while maintaining all required safety margins.
ENGINE 5 — NETWORK + REPOSITIONING ENGINE™
One of the largest hidden costs is:
MOVING EMPTY EQUIPMENT.
Traditional flow:
SOURCE A
→ Customer B
→ Empty return to A
Better network:
SOURCE A
→ Customer B
→ Nearby Source C
→ Customer D
→ Source E
→ Customer F
This creates:
TRIANGULATION™
or
MULTI-LEG FCF ROUTING™
The objective:
MINIMIZE EMPTY KILOMETERS.
MINIMIZE EMPTY DAYS.
MAXIMIZE REVENUE-GENERATING LEGS.
ENGINE 6 — RELIABILITY + LIFECYCLE ENGINE™
The cryogenic container must remain:
SAFE
COMPLIANT
AVAILABLE
RELIABLE
ECONOMIC
Cryogenic ISO fleets require ongoing inspection, repair, maintenance and tracking; commercial operators explicitly treat asset maintenance as part of fleet reliability and operating efficiency. (Air Liquide Maritime)
Track:
Preventive maintenance
Inspection due dates
Unplanned failures
Vacuum performance
Valve condition
Repair cost
Downtime
Remaining economic life
MASTER RULE
MAINTAIN BEFORE FAILURE™
But also:
DO NOT OVER-MAINTAIN PRODUCTIVE ASSETS.
ENGINE 7 — CAPITAL COMPOUNDING ENGINE™
Every additional container must compete for capital.
Possible decisions:
BUY NEW
LEASE
RENT
REDEPLOY
REFURBISH
EXTEND LIFE
RETIRE
Air Liquide, for example, offers cryogenic ISO containers on both short- and long-term rental arrangements, illustrating that ownership is only one possible capacity model. (Air Liquide Maritime)
Compare:
INCREMENTAL FCF ÷ INCREMENTAL CAPITAL
The answer may be:
BUY
or
LEASE
or
USE EXISTING FLEET BETTER.
THE CRITICAL FCF LOOP™
CUSTOMER DEMAND
↓
CONTAINER ASSIGNED
↓
LOAD MOLECULE
↓
FULL REVENUE LEG
↓
CUSTOMER DELIVERY
↓
FAST TURNAROUND
↓
SMART REPOSITIONING
↓
NEXT FULL REVENUE LEG
↓
MORE TURNS
↓
MORE FCF / CONTAINER
↓
HIGHER ROCE
↓
REINVEST
↓
MORE HIGH-VALUE CONTAINER CAPACITY
↺
THE ONE CRITICAL METRIC™
For the entire system I would make one number dominant:
FCF PER ACTIVE CONTAINER PER YEAR™
It forces management to integrate:
Price
Payload
Turns
Utilization
Freight
Repositioning
Maintenance
Losses
Capital employed
into ONE economic result.
CRYO CONTAINER FCF COCKPIT™
10 NUMBERS. ONE FLEET DECISION.
| KPI | Decision Question |
|---|---|
| 1. Active Containers | How much productive capacity do we have? |
| 2. Utilization % | How much of the fleet is working? |
| 3. Turns / Container | How often does capital earn revenue? |
| 4. Days / Turn | Where is time trapped? |
| 5. Payload / Turn | Are we moving enough saleable product? |
| 6. Empty km / Days | How much repositioning waste exists? |
| 7. Product Loss % | How much molecule value is lost? |
| 8. Maintenance Availability | Is the fleet ready when needed? |
| 9. FCF / Turn | Is each movement economically attractive? |
| 10. FCF / Active Container / Year | Is container capital compounding? |
CUSTOMER / ROUTE MATRIX™
Every lane enters one of four categories:
HIGH FCF + HIGH UTILIZATION
SCALE
HIGH FCF + LOW UTILIZATION
ADD DENSITY
LOW FCF + HIGH UTILIZATION
REPRICE / OPTIMIZE
LOW FCF + LOW UTILIZATION
REDESIGN / EXIT
THE CONTAINER CONTROL TOWER™
Every container should have ONE live economic status:
GREEN — PRODUCTIVE
Loaded / revenue-generating.
AMBER — TURNAROUND
Unloading / cleaning / inspection / repositioning.
RED — NON-PRODUCTIVE
Idle / unnecessary empty movement / maintenance delay / blocked.
Management should see immediately:
Where is my container?
What is inside it?
When will it earn again?
What FCF has it generated?
DACH + CEE CLUSTER LOGIC™
The highest-value model is not:
Country A → Country B → Empty Return
but:
SOURCE → CUSTOMER → SOURCE → CUSTOMER → SOURCE™
Build interconnected clusters around:
ASUs
Liquid-product surpluses
Ports
Rail terminals
Industrial clusters
Large customers
Depots
Maintenance centers
Then orchestrate container movement across DACH + CEE instead of optimizing individual national movements.
THE STRATEGIC CHOKEPOINT™
The apparent constraint may be:
“We need more containers.”
But the real constraint can be:
Low turns
Customer dwell
Port dwell
Empty repositioning
Poor source balancing
Maintenance downtime
Poor contract economics
Therefore:
DO NOT BUY THE NEXT CONTAINER UNTIL YOU KNOW WHY THE EXISTING ONE IS NOT TURNING FASTER.™
ONE DECISION™
MANAGE CRYO CONTAINERS AS CASH-PRODUCING CAPITAL ASSETS — NOT TRANSPORT EQUIPMENT.
Change:
CONTAINER → DELIVERY
into:
CONTAINER → TURN → FCF → REDEPLOY → TURN → COMPOUND™
INDUSTRIAL GAS CRYO CONTAINER 2030™
TRACKED
CONNECTED
MULTIMODAL
HIGH-UTILIZATION
LOW-EMPTY-MILEAGE
FAST-TURNING
RELIABLE
CAPITAL-DISCIPLINED
AI-ORCHESTRATED
FCF-COMPOUNDING
ONE CONTAINER. MANY TURNS. RECURRING FCF.™
ACTION CHECKLIST™
☐ Identify every active cryogenic container
☐ Record gas compatibility and technical configuration
☐ Calculate capital employed per container
☐ Track productive versus idle days
☐ Calculate days per complete turn
☐ Measure payload per trip
☐ Measure product losses
☐ Measure customer dwell
☐ Measure empty km and empty days
☐ Map all sources and destinations
☐ Identify triangulation opportunities
☐ Calculate FCF per route
☐ Calculate FCF per turn
☐ Calculate annual FCF per container
☐ Rank fleet by ROCE
☐ Reprice or redesign low-FCF routes
☐ Optimize fleet before buying additional equipment
☐ Identify the ONE current fleet chokepoint
☐ Fix it
☐ Scale only after the economics are proven
FINAL PASS / FAIL™
Can we increase FCF from the existing cryogenic-container fleet without adding another container?
YES
OPTIMIZE → PROVE → THEN SCALE.
NO
Locate the constraint:
CUSTOMER?
SOURCE?
FILL?
TRANSIT?
DWELL?
EMPTY RETURN?
MAINTENANCE?
CONTRACT?
Fix the ONE constraint first.
RapidKnowHow® MASTER FORMULA™
PAYLOAD × TURNS × UTILIZATION × MARGIN × AVAILABILITY
divided by
Leave a Reply