Answer:
Demonstrating your corporate strategy in a simple illustration can be a challenging task, especially if your strategy is complex and multifaceted. However, it’s not impossible. The key is to break down your strategy into its core components and then visually represent these components in a way that’s easy to understand. Here are some methods you can use:
*Idea Illustration*
1. **Flowcharts**: Flowcharts are a great way to illustrate your corporate strategy. They allow you to show the flow of processes and decisions that make up your strategy. For example, if your corporate strategy involves improving customer service, you could create a flowchart that starts with “Customer contacts support” and then branches out into different possible scenarios.
2. **Mind Maps**: Mind maps are another effective tool for illustrating ideas. They allow you to visually organize information in a way that shows the relationships between different parts of your strategy. For example, if part of your corporate strategy involves expanding into new markets, you could create a mind map that starts with “Expansion” at the center and then branches out into different potential markets.
3. **Infographics**: Infographics combine text and visuals to convey information in an engaging way. You could create an infographic that outlines the key points of your corporate strategy, using icons and images to represent different elements of the strategy.
**Idea Exploration**
1. **SWOT Analysis**: A SWOT analysis (Strengths, Weaknesses, Opportunities, Threats) can be used to explore different aspects of your corporate strategy. For example, you could create a SWOT analysis that looks at the strengths and weaknesses of your current strategy, as well as the opportunities and threats presented by the market.
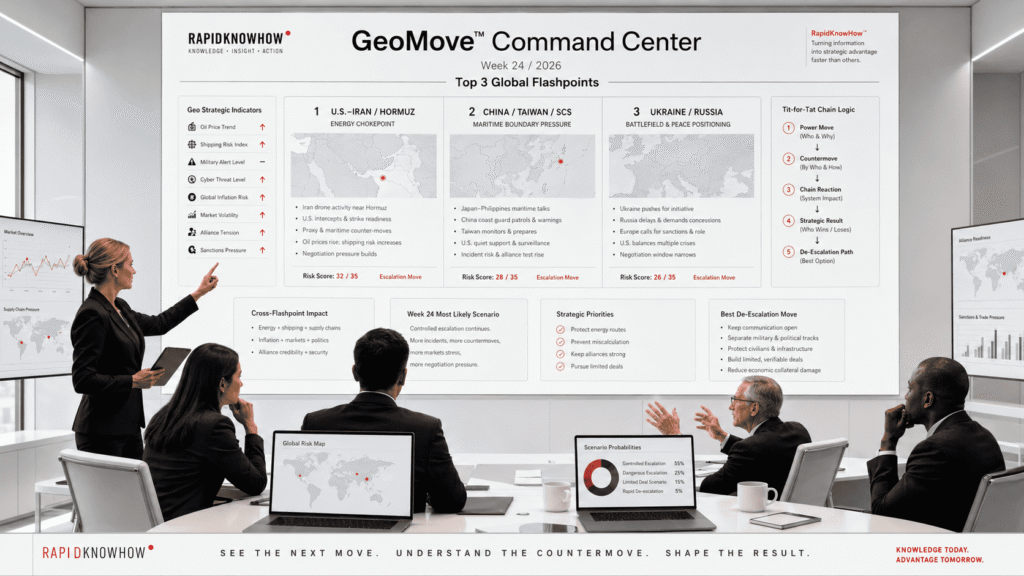
2. **Scenario Planning**: Scenario planning involves creating detailed narratives about possible future situations to explore how your corporate strategy might play out. For example, you could create scenarios based on different economic conditions or competitive landscapes.
3. **Decision Trees**: Decision trees can be used to explore the potential outcomes of different strategic decisions. For example, if your corporate strategy involves launching a new product, you could create a decision tree that explores the potential outcomes based on different pricing strategies or marketing campaigns.
**Visual Discovery**
1. **Data Visualization**: Data visualization involves using graphical representations of data to discover patterns, trends, and insights. For example, if your corporate strategy involves increasing sales, you could use a bar chart or line graph to visualize sales data over time.
2. **Concept Maps**: Concept maps are graphical tools that can be used to organize and represent knowledge. They can be particularly useful for discovering and illustrating the relationships between different elements of your corporate strategy.
3. **Dashboards**: Dashboards provide a visual display of key performance indicators (KPIs) related to your corporate strategy. For example, if your strategy involves improving operational efficiency, you could create a dashboard that displays metrics like production costs, delivery times, and defect rates.
In conclusion, there are many ways to illustrate your corporate strategy in a simple and understandable way. The key is to choose the right method for your specific needs and to use visuals effectively to convey your message.