
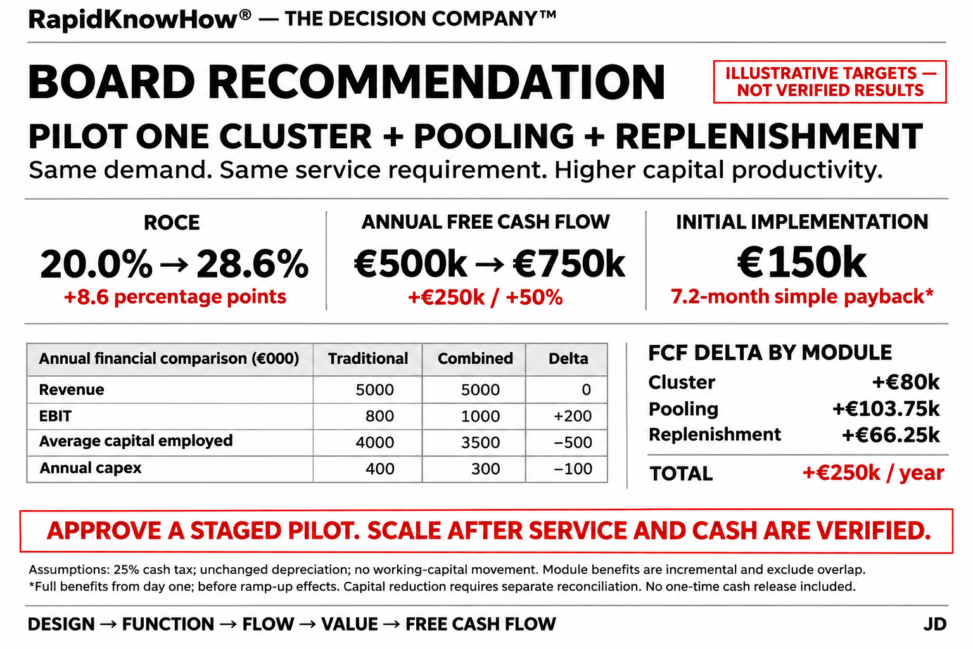
Decision hypothesis: combining demand density, faster asset circulation and better delivery scheduling can increase FCF and ROCE while maintaining service.
Illustrative supplier/operator case. All figures are assumptions in €000. Same revenue, demand and service requirements; full-year benefits after implementation.
| Financial measure | Traditional | Combined model | Delta |
|---|---|---|---|
| Revenue | 5,000 | 5,000 | — |
| Cash operating costs | 3,900 | 3,700 | −200 |
| Depreciation | 300 | 300 | — |
| EBIT | 800 | 1,000 | +200 |
| Average capital employed | 4,000 | 3,500 | −500 |
| ROCE | 20.0% | 28.6% | +8.6 pp |
| Operating cash flow¹ | 900 | 1,050 | +150 |
| Annual capex | 400 | 300 | −100 |
| Annual FCF | 500 | 750 | +250 / +50% |
¹EBIT less assumed cash tax of 25%, plus depreciation; no working-capital movement or financing flows.
Separate cash bridges — who delivers the €250,000?
Each column shows the additional contribution after the preceding modules, rather than adding overlapping standalone estimates.
| Annual incremental cash bridge | Cluster | + Pooling | + Replenishment | Total |
|---|---|---|---|---|
| Distinct cash operating savings | 100 | 60 | 100 | 260 |
| Additional operating/system costs | −20 | −15 | −25 | −60 |
| Net EBIT improvement² | 80 | 45 | 75 | 200 |
| Incremental cash tax | −20 | −11.25 | −18.75 | −50 |
| Operating cash improvement | 60 | 33.75 | 56.25 | 150 |
| Lower required annual capex | 20 | 70 | 10 | 100 |
| Recurring annual FCF delta | 80 | 103.75 | 66.25 | 250 |
²Assumes unchanged depreciation.
| Module | Benefit assigned exclusively to it | Proof required |
|---|---|---|
| Cluster | Shorter regular delivery routes through geographic coordination | Route kilometres, loads and actual transport expenditure |
| Pooling | Lower asset losses and handling expenditure; fewer replacement purchases | Cylinder/pallet records, paid costs and cancelled purchase requirements |
| Replenishment | Fewer emergency deliveries and unnecessary scheduled stops | Consumption, delivery records and actual avoided expenditure |
No double counting: value each avoided trip once. Assign each avoided asset purchase to one module. Staff time counts as cash savings only when expenditure falls. Count additional system costs once.
Transition cash and capital
| Item | Illustrative treatment |
|---|---|
| Initial implementation cash | €150,000 |
| Full-year incremental FCF | €250,000 |
| Net benefit over first 12 months if benefits start immediately | €100,000 |
| Simple payback under that assumption | 7.2 months |
| One-time disposal/deposit proceeds | Excluded until evidenced |
| €500,000 lower average capital employed | Requires a separate book-value and working-capital reconciliation |
Lower recurring capex must reflect a sustainably smaller asset requirement. Deferring necessary replacement would overstate FCF.
Recommendation: approve a staged ONE-cluster pilot, implementing pooling and replenishment within it. Release wider investment when measured service holds and each module’s cash bridge is supported.
Board proposition: same demand and service; ROCE 20.0% → 28.6%; annual FCF +€250,000. These are targets to validate—not delivered results.
RapidKnowHow® — THE DECISION COMPANY™
Industrial Gas Leadership 2030
PROVE VALUE. THEN SCALE.
Watch the 60-second roadmap: 10 strategic actions for DACH and CEE, 2026–2030.
Start with ONE customer challenge. Use the Industrial Gas Action Guide to turn your first action into a measurable result.
RapidKnowHow® — Leading Industrial Gas Opportunity Signal Identifier in DACH & CEE