
GENERATE MORE FREE CASH FLOW. EARN MORE FROM THE CAPITAL EMPLOYED. BUILD REPEATABLE CUSTOMER VALUE.
RapidKnowHow® — THE DECISION COMPANY™
ONE STRATEGIC QUESTION
Where should an industrial gas leader direct resources?
Maintain traditional gas supply, optimise the existing business, or develop globally reusable know-how?
Compare the alternatives through two measures:
- Free Cash Flow — FCF: cash available after operating costs, cash taxes, investment and additional working capital.
- Return on Capital Employed — ROCE: operating profit before interest and tax relative to average capital employed.
FCF measures cash generation. ROCE measures capital productivity.
THREE VALUE STRATEGIES
1. TRADITIONAL LOCAL GAS SUPPLY
Sell gases through an established distribution and service network.
Value comes from reliable supply, customer relationships and repeat consumption. Cash generation depends on margins, equipment utilisation, delivery efficiency and payment collection.
Strategic priority: protect profitable supply and control capital requirements.
2. OPTIMISED LOCAL GAS BUSINESS
Improve pricing, route density, asset utilisation and cash collection.
The objective is to earn more from the existing operating platform while reducing unnecessary investment and working-capital demands.
Strategic priority: increase operating profit before expanding the asset base.
3. GLOBAL KNOW-HOW BUSINESS
Convert industrial gas expertise into decision guides, paid mandates and annual licences.
Value comes from solving repeatable customer problems and reusing the method across customers and markets.
Customer acquisition, expert delivery, updates and renewals determine whether the model succeeds.
Strategic priority: prove paid demand, then scale profitable reuse.
THE TEST MODEL
All figures below are illustrative assumptions—not industry averages, forecasts or verified RapidKnowHow results.
Each strategy represents a separate established business generating €1 million annual revenue. This is a comparison of operating economics after reaching that revenue level.
Launch costs, transition costs and the time required to reach that scale are excluded.
This extension adds explicit depreciation and capital assumptions to calculate ROCE. It also calculates simplified cash tax from EBIT, so its FCF figures differ from the earlier cash-only example.
Annual operating assumptions
Figures in €000. Parentheses indicate cash outflows.
| Measure | Traditional gas | Optimised gas | Global know-how |
|---|---|---|---|
| Annual revenue | 1,000 | 1,000 | 1,000 |
| Cash operating costs | (800) | (740) | (650) |
| Operating surplus before depreciation | 200 | 260 | 350 |
| Depreciation and amortisation | (60) | (60) | (20) |
| EBIT | 140 | 200 | 330 |
| Assumed cash tax: 25% of EBIT | (35) | (50) | (82.5) |
| Annual capital expenditure | (60) | (60) | (20) |
| Annual increase in working capital | (20) | (10) | 0 |
| Annual FCF | 85 | 140 | 247.5 |
| FCF margin | 8.5% | 14.0% | 24.75% |
| Opening capital employed | 600 | 550 | 200 |
Cash operating costs include market-rate management and expert compensation.
FCF = EBIT − cash tax + depreciation and amortisation − capital expenditure − increase in working capital.
Capital expenditure equals depreciation and amortisation in this simplified model. Consequently, net operating fixed assets remain constant; capital employed increases only through the assumed annual working-capital additions.
The gas cases represent distribution and service operations—not newly constructed air separation plants.
COMPARISON OVER 3 YEARS
| Measure | Traditional gas | Optimised gas | Global know-how |
|---|---|---|---|
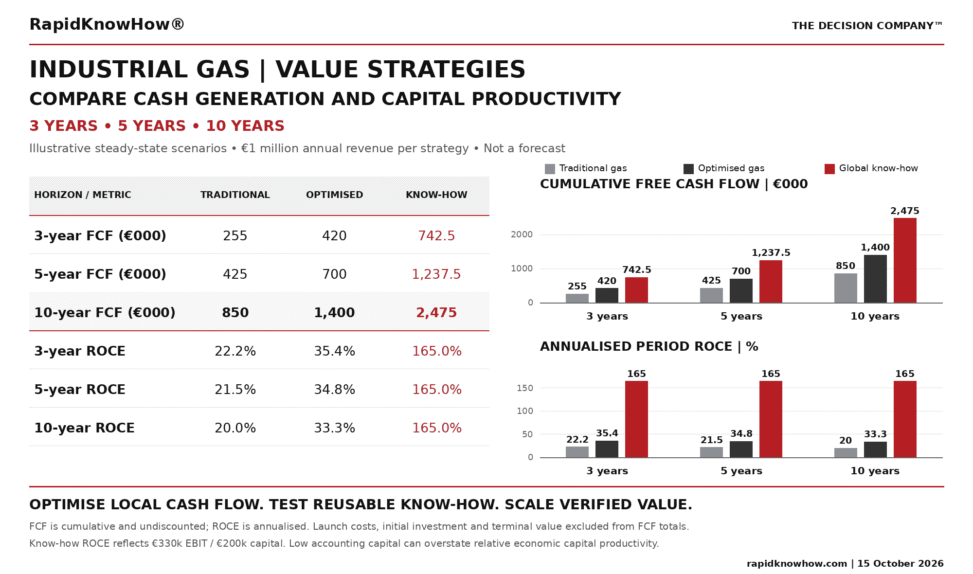
| Cumulative FCF | €255,000 | €420,000 | €742,500 |
| Average capital employed over the period | €630,000 | €565,000 | €200,000 |
| Annualised period ROCE | 22.2% | 35.4% | 165.0% |
| Additional cumulative FCF versus traditional | — | €165,000 | €487,500 |
Three-year interpretation: Operational improvement can materially strengthen the gas business. Know-how produces the highest cash generation in this scenario, provided the assumed revenue and delivery economics are achieved.
COMPARISON OVER 5 YEARS
| Measure | Traditional gas | Optimised gas | Global know-how |
|---|---|---|---|
| Cumulative FCF | €425,000 | €700,000 | €1,237,500 |
| Average capital employed over the period | €650,000 | €575,000 | €200,000 |
| Annualised period ROCE | 21.5% | 34.8% | 165.0% |
| Additional cumulative FCF versus traditional | — | €275,000 | €812,500 |
Five-year interpretation: Sustained operating discipline creates a growing cash advantage. A know-how business must preserve customer relevance, renewals and delivery quality to maintain its assumed advantage.
COMPARISON OVER 10 YEARS
| Measure | Traditional gas | Optimised gas | Global know-how |
|---|---|---|---|
| Cumulative FCF | €850,000 | €1,400,000 | €2,475,000 |
| Average capital employed over the period | €700,000 | €600,000 | €200,000 |
| Annualised period ROCE | 20.0% | 33.3% | 165.0% |
| Additional cumulative FCF versus traditional | — | €550,000 | €1,625,000 |
Ten-year interpretation: Small recurring differences in margin, reinvestment and working capital accumulate into substantial cash differences.
These cumulative figures are undiscounted operating cash totals. They exclude the initial investment and any terminal value. They are neither investment returns nor business valuations.
READ THE ROCE FIGURES CORRECTLY
Annualised period ROCE is calculated as:
Average annual EBIT ÷ Average capital employed over the period × 100.
ROCE is an annualised percentage. It is not multiplied by three, five or ten.
The gas-model percentages decline because working capital continues to accumulate while EBIT remains constant.
The know-how model’s 165% ROCE reflects the assumed €330,000 annual EBIT relative to €200,000 of recognised capital employed. It is not a sector benchmark or an investor-return promise.
Know-how businesses may expense substantial spending on expertise, customer acquisition and intellectual-property development. Accounting capital can therefore understate their full economic investment.
Assess ROCE alongside FCF, acquisition costs, renewal rates and founder dependence.
WHAT COULD CHANGE THE RANKING?
The know-how strategy becomes less attractive when:
- Customers will not pay the assumed prices.
- Acquisition costs exceed the budget.
- Delivery requires extensive custom work.
- Licence renewals are weak.
- The founder remains essential to every sale and delivery.
The gas strategies become more attractive when:
- Existing assets have spare profitable capacity.
- Pricing improves without losing valuable customers.
- Route density increases.
- Receivables and inventory release cash.
- Reliability and service strengthen retention.
The model demonstrates the consequences of its assumptions. Paid demand and operating evidence determine which strategy deserves investment.
ONE DECISION
FOR AN EXISTING GAS OPERATOR: OPTIMISE THE CASH ENGINE, THEN TEST REUSABLE KNOW-HOW AS AN ADDITIONAL VALUE STRATEGY.
FOR RAPIDKNOWHOW: PRIORITISE KNOW-HOW THAT CUSTOMERS CAN APPLY REPEATEDLY, WITHOUT OWNING GAS-PRODUCTION ASSETS.
Start with ONE customer problem:
Improve cash conversion without weakening supply reliability.
TOP 3 ACTIONS
- BASELINE: Establish actual EBIT, cash taxes, reinvestment, working capital and average capital employed.
- TEST: Compare operational improvement with one tightly scoped, paid know-how pilot.
- SCALE: Expand the route that demonstrates useful customer results, positive FCF and disciplined capital use.
30-DAY RESULT: One evidence-based comparison and one paid pilot with a documented baseline, responsible owner and measurable outcome.
LOCAL PROOF → REUSABLE METHOD → RECURRING CUSTOMER VALUE → TRANSFERABLE FCF.
RapidKnowHow® — THE DECISION COMPANY™
ONE challenge. ONE decision. ONE measurable result.