Visualizing Complex Market Strategies Using Visuals
The use of visuals in market strategies is a powerful tool that can simplify complex concepts, enhance understanding, and facilitate decision-making. Visuals can range from simple diagrams to sophisticated data visualization tools. They can help to illustrate trends, patterns, and relationships that might be difficult to understand in text form.
Best Visuals for Market Strategies
1. Infographics: These are great for presenting a lot of information in an easy-to-understand format. They can be used to illustrate the steps in a process, show the components of a product or service, or present statistical data.
2. Charts and Graphs: These are excellent for showing trends, comparisons, and relationships. They can be used to illustrate sales trends, market share comparisons, or customer behavior patterns.
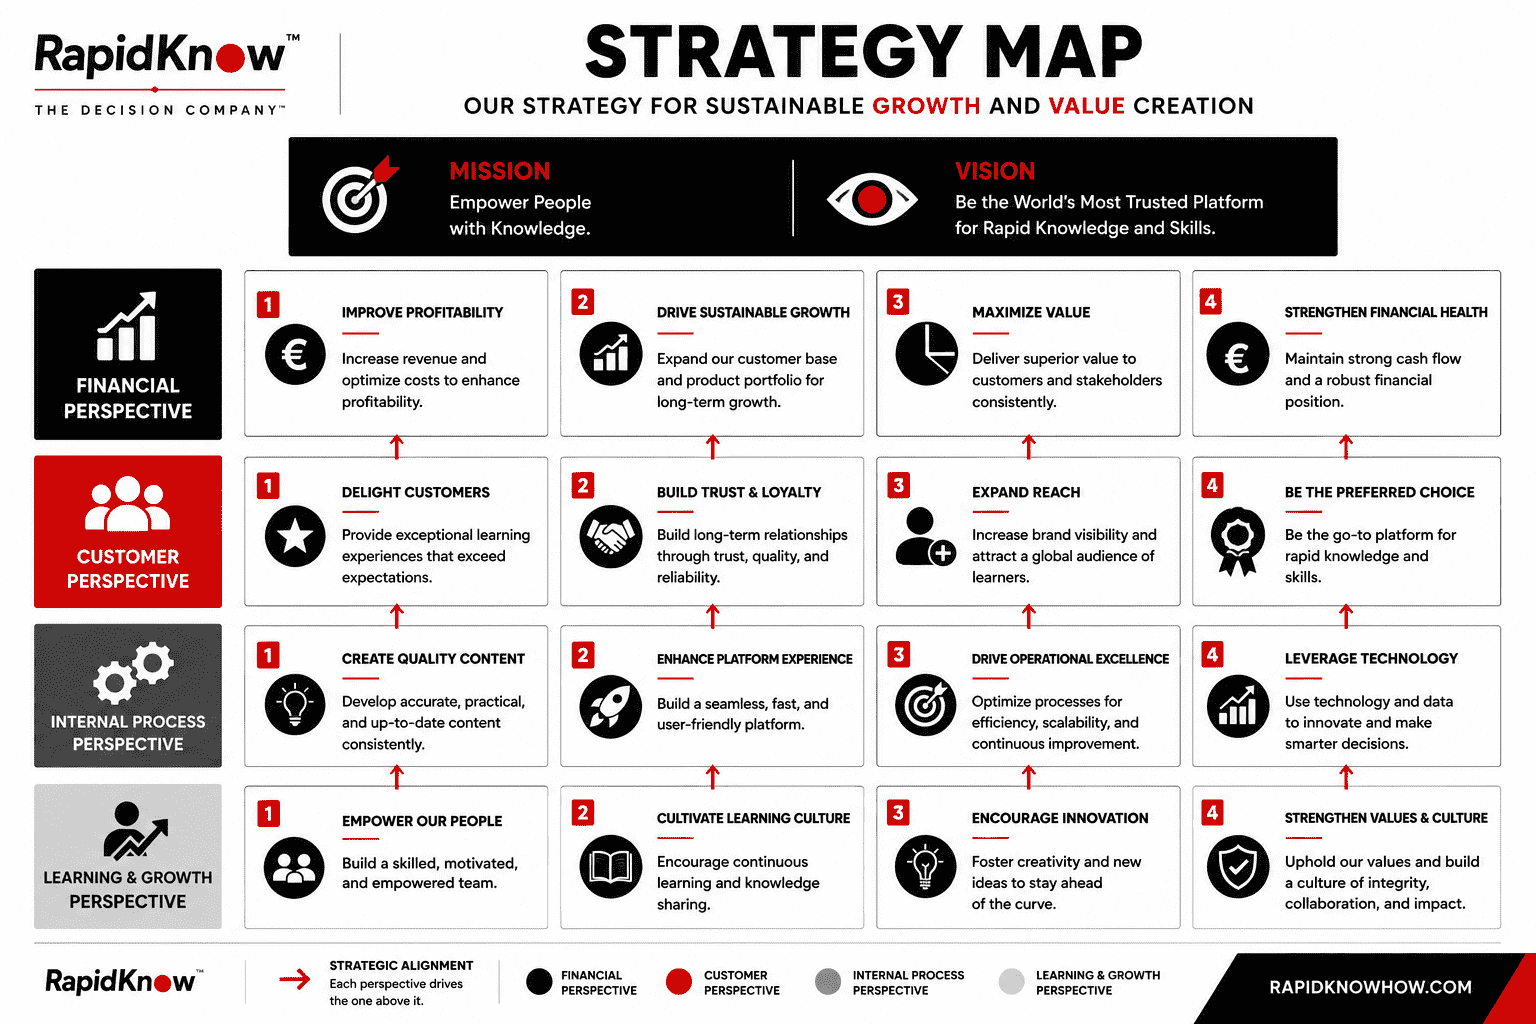
3. Diagrams: These are useful for showing processes, systems, or structures. They can be used to illustrate a company’s organizational structure, a product’s lifecycle, or a business process.
How to communicate Market Strategies effectively
Expansion Strategies
Expansion strategies involve growing the business by entering new markets or increasing market share in existing markets.
Visuals such as geographic maps can be used to show potential new markets or areas of market growth. Bar graphs and pie charts can be used to illustrate market share.
Competitive Strategies
Competitive strategies involve positioning the business against competitors.
Visuals such as SWOT analysis diagrams (Strengths, Weaknesses, Opportunities, Threats) can be used to compare the company’s strengths and weaknesses with those of its competitors.
Relationship Strategies
Relationship strategies involve building strong relationships with customers, suppliers, and other stakeholders.
Visuals such as relationship maps can be used to show the connections between the company and its stakeholders.
Acquisition Strategies
Takeover strategies involve acquiring other companies to increase market share or gain access to new markets or technologies.
Visuals such as flowcharts can be used to illustrate the steps in the acquisition process.
Greengrass Strategies
Greengrass strategies involve starting new ventures or projects within the company.
Visuals such as project timelines or Gantt charts can be used to plan and track these ventures.
Franchise Strategies
Franchise strategies involve expanding the business by granting franchises to independent business owners.
Visuals such as franchise maps can be used to show the locations of existing and potential franchises.
Other Strategies
There are many other types of market strategies, and the choice of visuals will depend on the specific strategy.
For example, a pricing strategy might be illustrated with a price comparison chart, while a product differentiation strategy might be illustrated with a product feature comparison table.
Conclusion and Next Steps
In conclusion, visuals are a powerful tool for visualizing market strategies.
They can simplify complex concepts, enhance understanding, and facilitate decision-making.
The next step is to choose the appropriate visuals for your specific market strategy and use them effectively to communicate your strategy to your team, your stakeholders, and your customers.
Remember that the best visuals are those that clearly and accurately represent the data or information, are easy to understand, and are engaging for the viewer.