
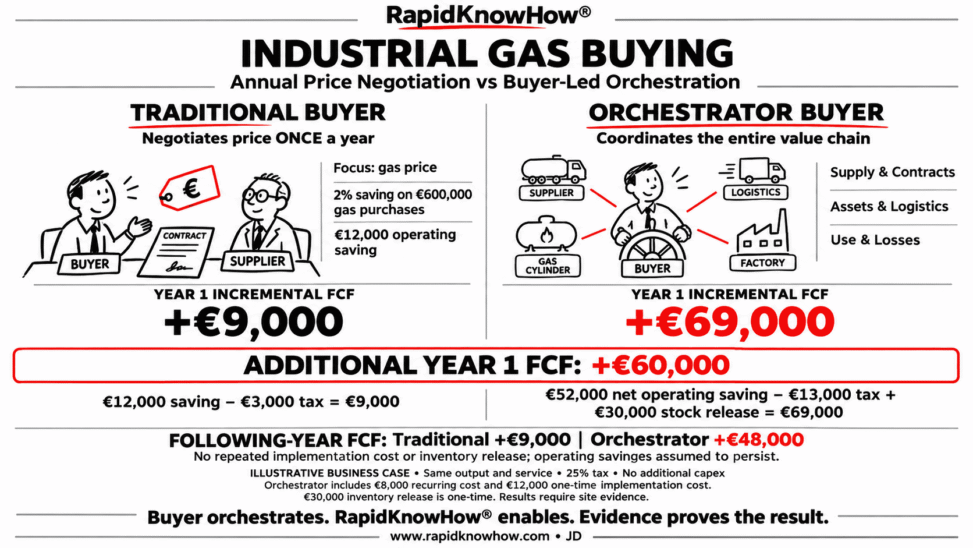
Business Case: Traditional Buying Organization versus Orchestrator Buying Organization
The strategic question
How much value can a buying organization create by managing the entire industrial-gas system rather than focusing mainly on its annual price negotiation?
The orchestrator retains price negotiation and adds continuous coordination across:
Supply & Contracts → Assets & Logistics → Use & Losses
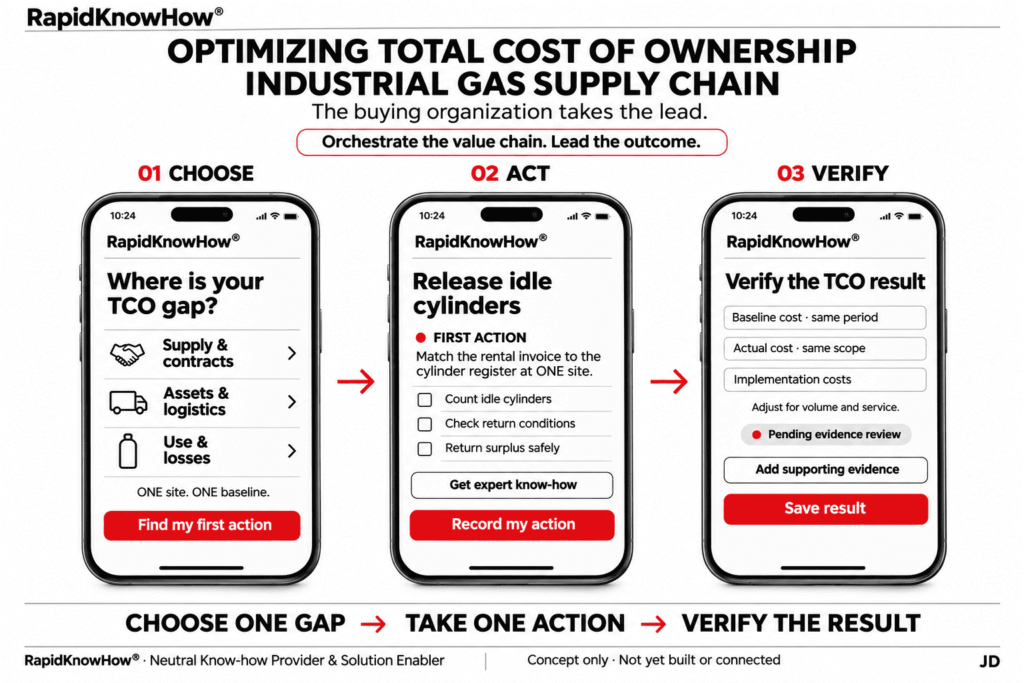
Its objective is to improve total cost, capital productivity and cashflow while maintaining safety, quality and supply reliability.
1. Compare the two operating models
| Dimension | Traditional: annual price focus | Orchestrator buying organization |
|---|---|---|
| Main question | What discount can we negotiate? | What total value can we create and verify? |
| Scope | Gas price and contract renewal | Entire gas supply-and-use system |
| Rhythm | Annual negotiation | Regular review and corrective action |
| Leadership | Procurement manages supplier negotiation | Buyer coordinates procurement, operations, maintenance, finance and suppliers |
| Assets | Rental terms reviewed | Physical assets reconciled with bills and usage |
| Consumption | Purchased volume tracked | Useful consumption, losses and output tracked |
| Inventory | Local replenishment practices | Demand, reserves, return cycles and stock coordinated |
| Success measure | Negotiated price reduction | Verified net cash benefit, EVA and service performance |
These are comparison models. Actual buying organizations may combine elements of both.
2. Illustrative business-case assumptions
Consider ONE industrial site with:
- €1,000,000 annual gas-related operating cost, including €600,000 of gas purchases.
- The same production output, gas specifications and required service level under both approaches.
- A 2% gas-price reduction, achieved by both organizations.
- 25% tax, with incremental tax effects paid in the year.
- €0 additional capex.
- All listed savings and implementation payments realized within Year 1.
The figures below are hypothetical, not supplier quotations, benchmarks or verified results.
3. Year 1 operating business case
| Annual improvement | Traditional | Orchestrator |
|---|---|---|
| Gas-price reduction | €12,000 | €12,000 |
| Lower delivery and logistics charges | — | €18,000 |
| Lower idle-asset rental charges | — | €12,000 |
| Lower gas purchases through loss reduction | — | €20,000 |
| Lower energy expenditure | — | €10,000 |
| Additional recurring coordination and monitoring cost | — | −€8,000 |
| One-time implementation cost | — | −€12,000 |
| Net operating cost reduction | €12,000 | €52,000 |
| Resulting Year 1 operating cost | €988,000 | €948,000 |
The loss-reduction benefit is valued at the negotiated gas price. Energy savings exclude costs already included in purchased-gas prices. Each benefit must be checked for overlap.
Freed staff capacity is excluded unless it changes actual expenditure. Reallocated fixed costs alone do not generate cash savings.
4. Translate the business case into free cashflow
Assume the orchestrator also releases €30,000 of buyer-owned inventory, without reducing required reserves. This is separate from the operating savings and is supported by lower replenishment payments.
| Year 1 cashflow impact | Traditional | Orchestrator |
|---|---|---|
| Operating improvement before tax | +€12,000 | +€52,000 |
| Additional cash tax | −€3,000 | −€13,000 |
| Operating benefit after tax | +€9,000 | +€39,000 |
| One-time inventory cash release | €0 | +€30,000 |
| Additional capex paid | €0 | €0 |
| Incremental free cashflow | +€9,000 | +€69,000 |
Illustrative additional Year 1 FCF from orchestration: €60,000.
Inventory reduction can release cash tied up in working capital, but it must be balanced against operating needs and supply conditions.
The €30,000 release is counted once. Returning supplier-owned rented cylinders does not automatically release buyer-owned capital.
5. Separate first-year cash from sustained performance
If the operating improvements persist:
| Measure | Traditional | Orchestrator |
|---|---|---|
| Year 1 incremental FCF | €9,000 | €69,000 |
| Following-year incremental FCF* | €9,000 | €48,000 |
Assumes unchanged savings, tax and payment conditions; no repeated implementation cost, further inventory release or additional capex.
The recurring comparison is therefore €39,000 additional annual FCF, rather than repeating the €60,000 first-year difference.
6. Verify economic value and risk separately
At an illustrative 8% annual capital cost, and assuming the €30,000 inventory reduction occurs evenly through Year 1, average invested capital falls by €15,000.
The orchestrator’s illustrative Year 1 EVA improvement is:
€39,000 additional NOPAT + €1,200 lower capital charge = €40,200.
The traditional model produces €9,000 additional NOPAT, with no assumed capital change.
Risk reduction requires its own evidence: supply continuity, emergency deliveries, quality deviations, reserve adequacy and incident records. Hypothetical avoided shutdown losses are excluded from the cash figures.
Conclusion
Annual price negotiation delivers a useful saving. Buyer-led orchestration creates additional opportunities by changing how gas is supplied, held, moved and used.
In this illustrative case:
Traditional buying: +€9,000 Year 1 FCF.
Orchestrator buying: +€69,000 Year 1 FCF.
The advantage depends on verified operational changes, implementation costs and maintained service—not on adopting the “orchestrator” title.
Recommended ONE action
Select ONE site and appoint ONE accountable buyer-side owner.
Start by reconciling ONE rental invoice, the physical cylinder register and the delivery history. Choose the highest-confidence action that can use existing resources, record its baseline, and verify the cash effect before expanding.
The buying organization orchestrates. RapidKnowHow® enables. The accounts and evidence prove the result. -Josef David
RapidKnowHow® — THE DECISION COMPANY™
Industrial Gas Leadership 2030
PROVE VALUE. THEN SCALE.
Watch the 60-second roadmap: 10 strategic actions for DACH and CEE, 2026–2030.
Start with ONE customer challenge. Use the Industrial Gas Action Guide to turn your first action into a measurable result.
RapidKnowHow® — Leading Industrial Gas Opportunity Signal Identifier in DACH & CEE